Outcomes Engine Reporting
SmartyGrants has produced some Excel and Word templates that you can use to report on data drawn from your Outcomes Engine fields. These templates are available on this page, alongside some advice about progress reporting and connecting your outcomes data to third-party software.
Please read our documentation on Outcomes Engine first before proceeding.
Default Outcomes Engine reports
We have a number of default Outcome Engine report templates to get you started with your reporting. Below you will see the name of the report, a brief description, the downloadable template (see below on how to upload the template into SmartyGrants), and an example of the report (using mock or dummy data) designed to show you what is possible using the Outcomes Engine to collect and report on data.
Report Name | Template | Example |
|---|---|---|
Project Detail This is a Word document that provides details about a single grantee's project, including outcomes data. | ||
Outcome Summary This is an Excel report that provides a summary of the number Grantmaker Outcomes per application. | ||
Metrics Summary This is an Excel report that provides the Grantmaker Metric progress and target data for a selected round. | ||
All Fields This is an Excel report that provides details across programs and rounds using the Outcomes Engine default standard sections. | ||
All Fields This is an Word report that provides details across programs and rounds using the Outcomes Engine default standard sections. | ||
Impact Report This is a PDF report developed using a mixture of Excel charts and Word documents (generated by the SmartyGrants reporting function) combined into a third-party report tool. | We don’t have a template for this but please use the example as guide to building out an Impact Report. |
How to upload a template and run a report in your SmartyGrants account
Follow these steps to download and upload the All Fields template report.
Download the All Fields template from the table above and save it locally.
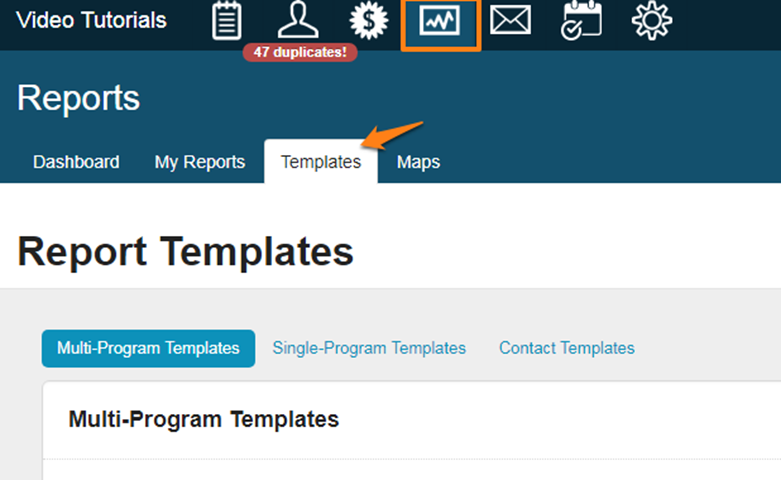
Click the Reports icon in the navigation panel at the top of your SmartyGrants screen.
Select the Templates tab
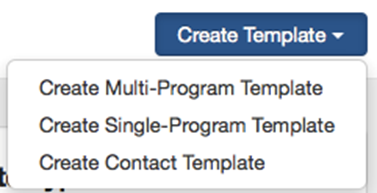
4. Select the Create Template button and select “Create Multi-Program Template”
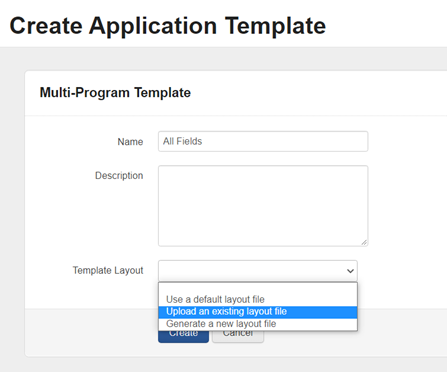
5. Name your template “All Fields” and select “Upload an existing layout file” from the template layout
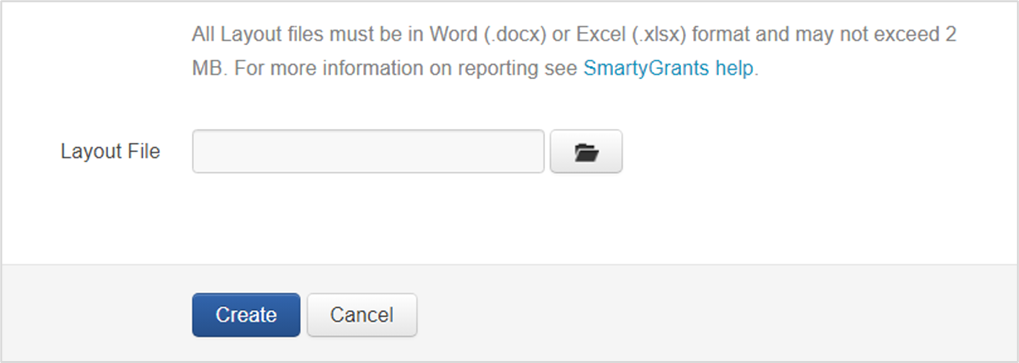
6. Upload the All Fields Template you saved locally and select Create.
7. Go to the My Reports tab and select Run Report.
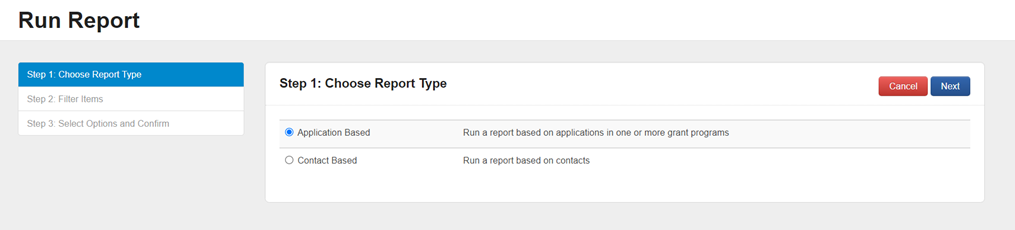
8. Select Application based and then Next.
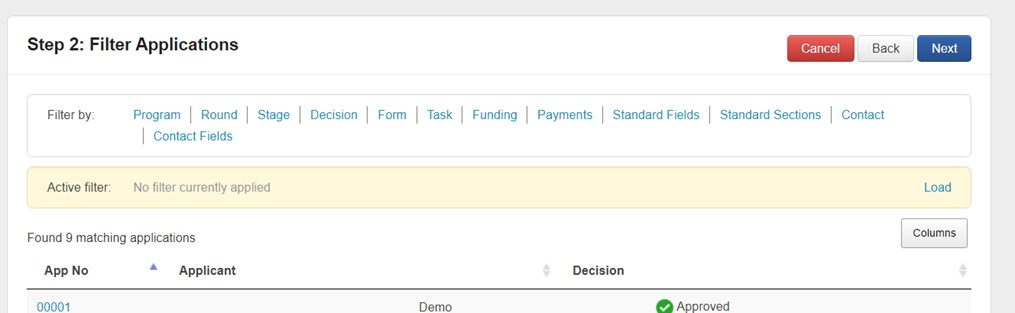
9. Select the round (or any other filter you like such as program).
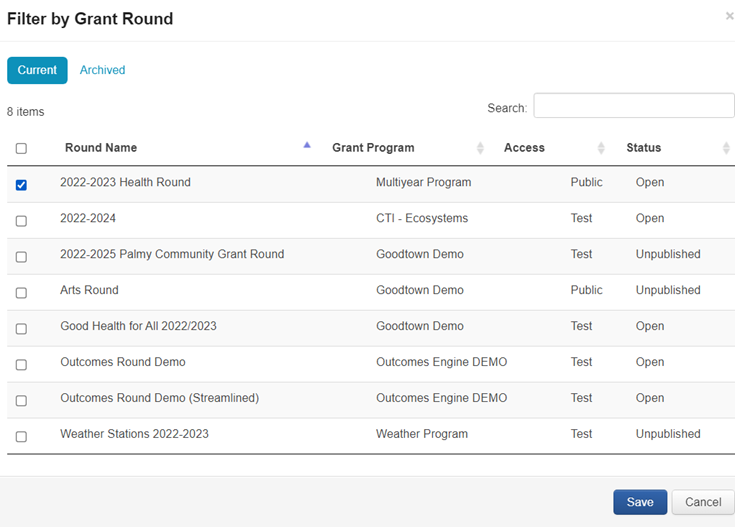
10. In the pop-up box select the round that you want to run the report on (i.e. 2022-2023 Health Round) and select Save.
11. Select Next and in the Report Template drop-down select the All Fields option. Select Confirm.
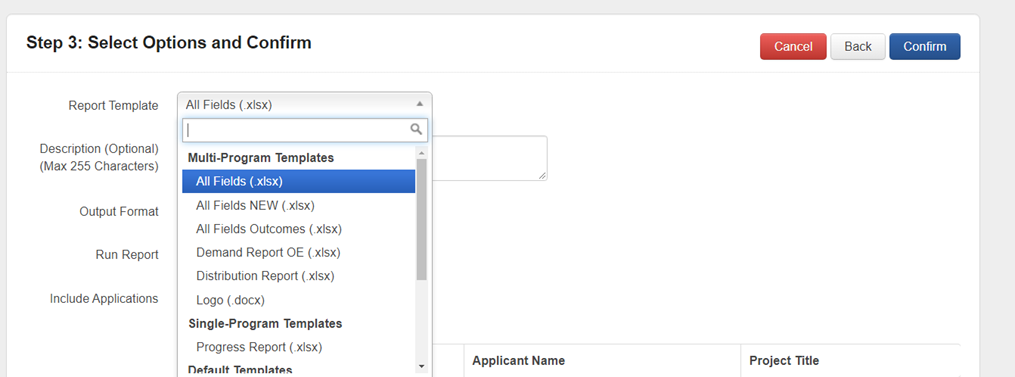
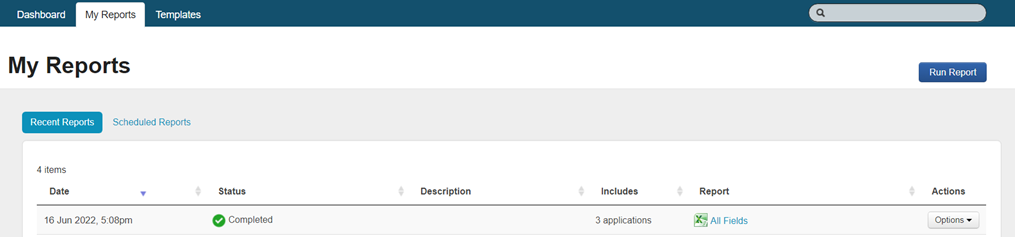
12. The report should appear in the “My Reports” tab. Select “All Fields.xlsx” to open the report.
Warning: You are downloading data out of the system that may be personal or sensitive information. Please follow your Privacy and Security protocols to ensure the data remains secure.
Updating the All Fields Report with custom standard fields and custom standard sections
This section contains instructions for editing the All Fields report template to:
Include custom standard fields that you have added to a default Outcomes Engine standard section
Include custom standard sections
The instructions assume that the All Fields template has not been previously edited, as movements or changes to code in the template may not be compatible with the instructions below.
Adding custom standard fields to a default Outcomes Engine standard section
The first step is to find the ‘code chunk’ for the custom standard field, which are bits of code contained within pointy brackets <> that generate responses to a question. We can do this by generating a report in SmartyGrants.
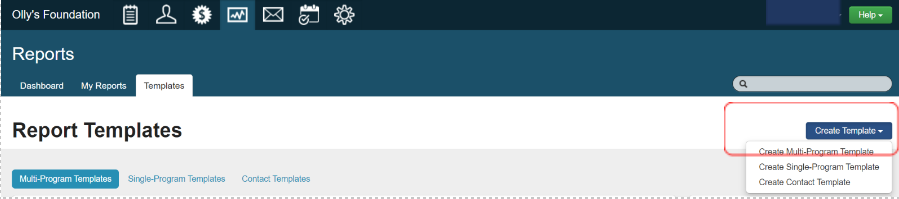
In Reports, click on the Templates tab. On the right-hand side of the page, click Create Template > Select Multi-Program Template.
For Template Layout, select Generate a new layout file and a tree structure showing fields for selection will appear.
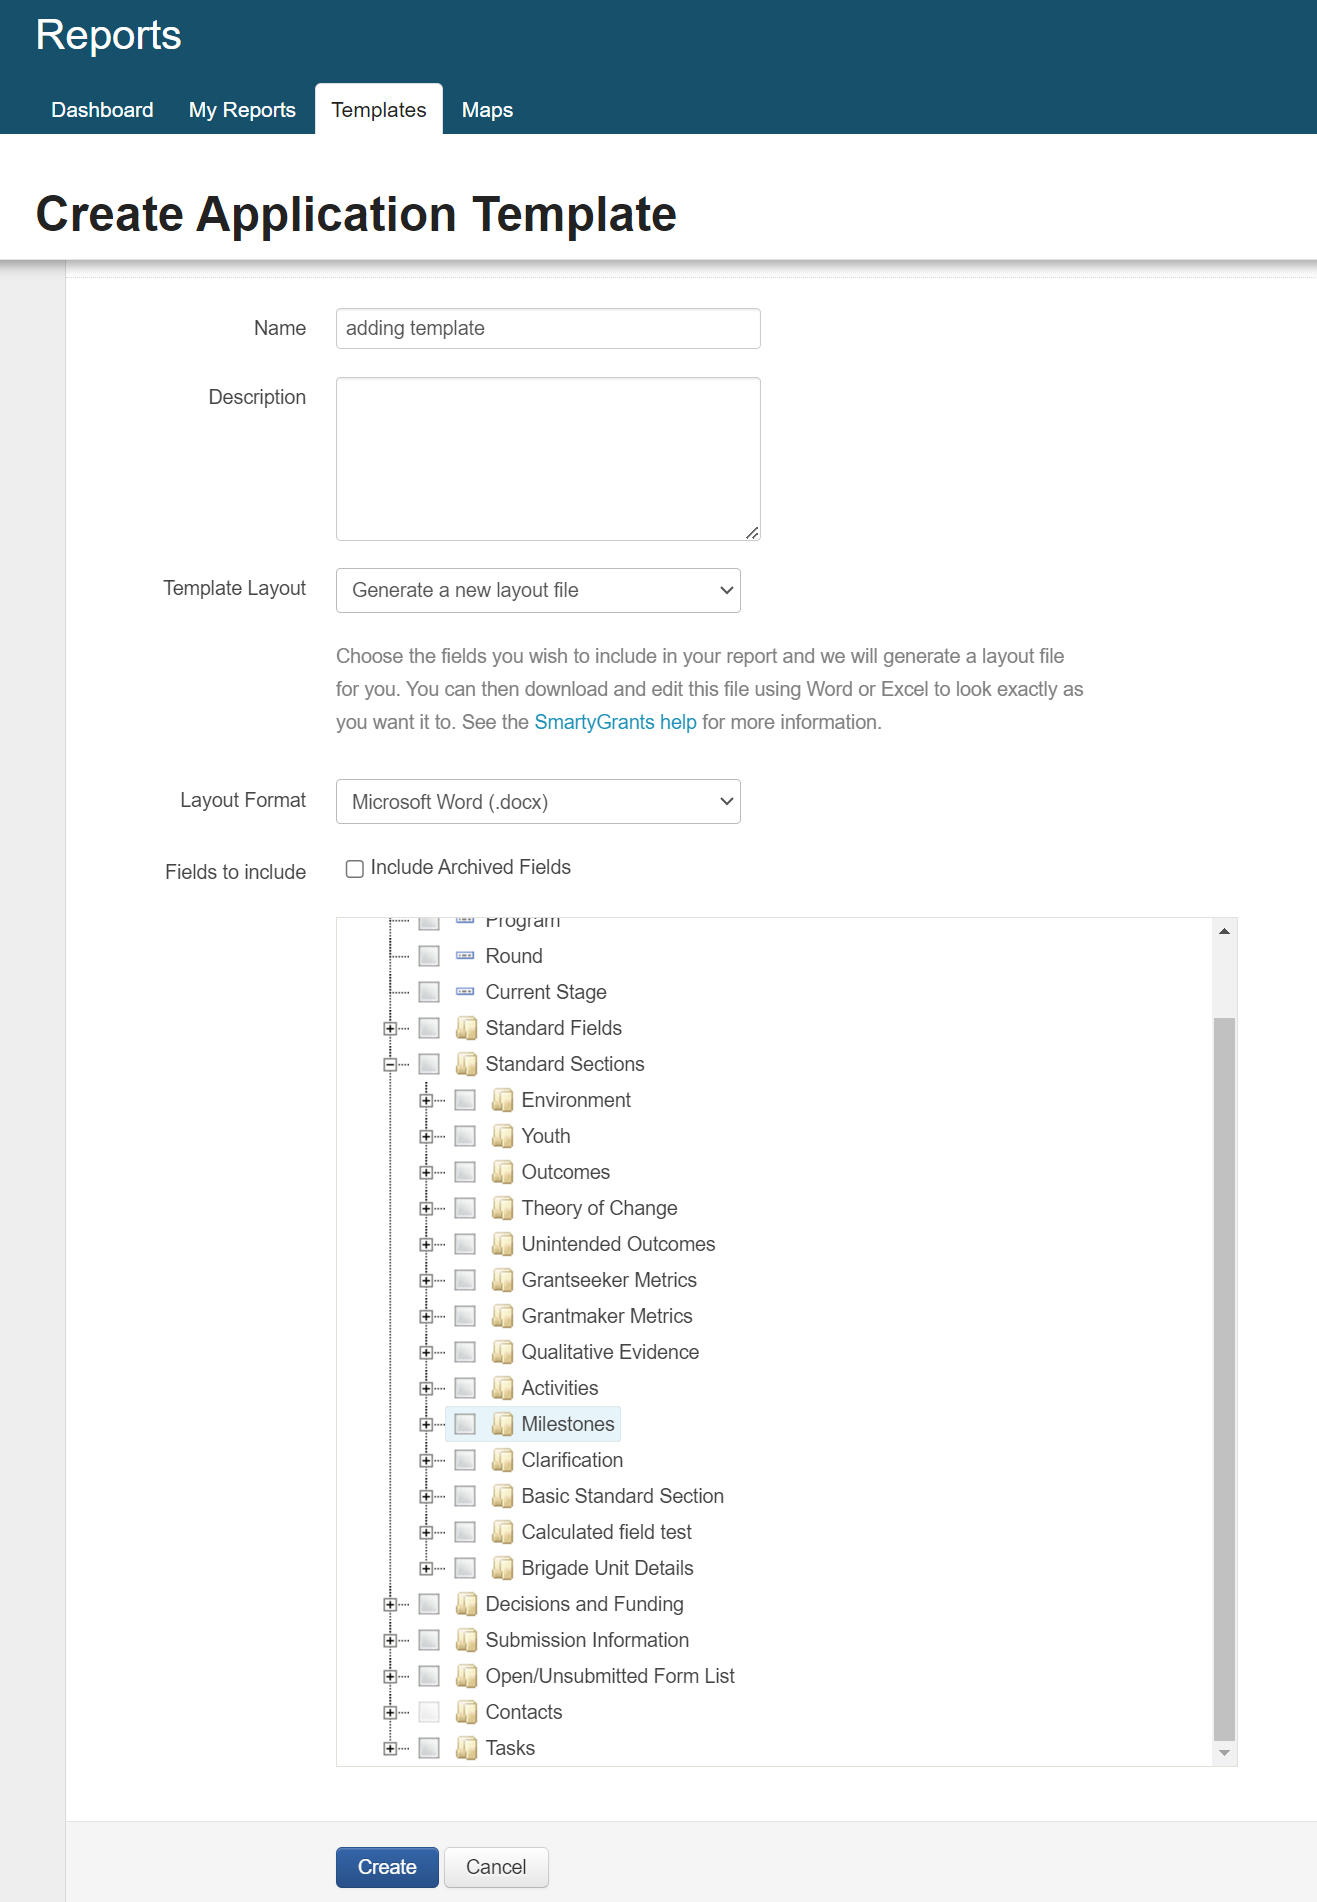
In the Fields to Include field tree, navigate to Standard Sections and find the name of the standard section (i.e. Grantseeker Metrics OC) containing the custom standard field (i.e. Baseline OE) you would like to add to All Fields.
Expand the standard section and tick the custom standard field (which automatically ticks the standard section). In this example, Baseline OE is ticked. You can tick multiple custom standard fields that you would like to Add (potentially across different standard sections).
Ensure Layout Format is set to Microsoft Excel. Give the desired Name and Description to the template. Click Create.
Download the template that has been created.
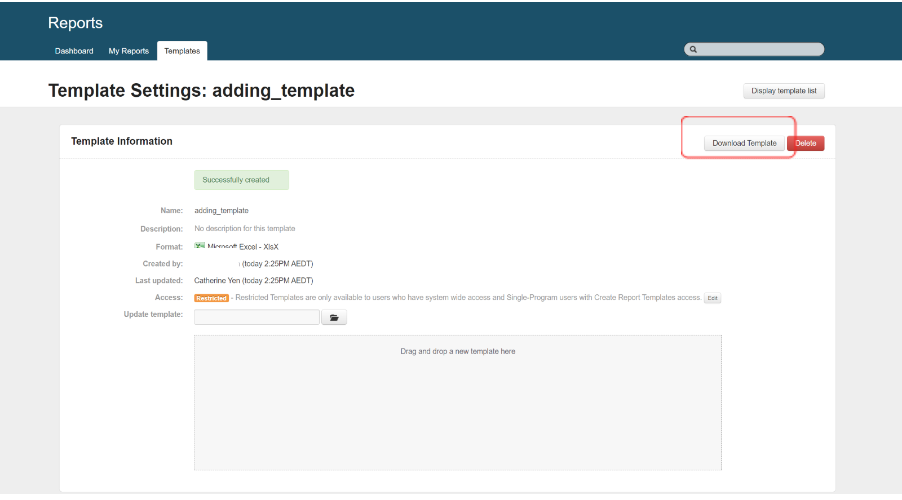
Open the template and click on the tab standard sections. Go to the cell below the cell containing the name of the standard section with the custom standard field you would like to add to All Fields.
Do not select and copy everything in the cell. Only copy one code chunk beginning with “<wr:out select” and ending with “/>”. In the middle of the code chunk, you should see the label of your custom standard field after “@name=”.
For example, only the line beginning with “<wr:out select” is highlighted to be copied.
Open your All Fields template. Select the tab with the standard section you want to add the field to i.e. Grantseeker Metrics. Enter a column where you want the data to appear and in the first row, type the name of the custom standard field as a header. In the second row below the header, paste the code chunk that was copied in the step above. There should be only one “<wr:out select” code chunk in this cell.
Save your changes to the template. This template is ready to be uploaded into SmartyGrants.
If you selected multiple custom standard fields from the field tree in Step 3, you can repeat Steps 4 and 5 until all the custom standard fields have been added into the template. There should be only one “<wr:out select” code chunk in each cell.
You can upload the template as a new template by returning to Reports and the Templates tab. Select Create Template > Select Multi-Program Template again. This time however, for Template Layout select “Upload an existing layout file” and upload your edited All Fields template.
Adding custom standard section to the All Fields report
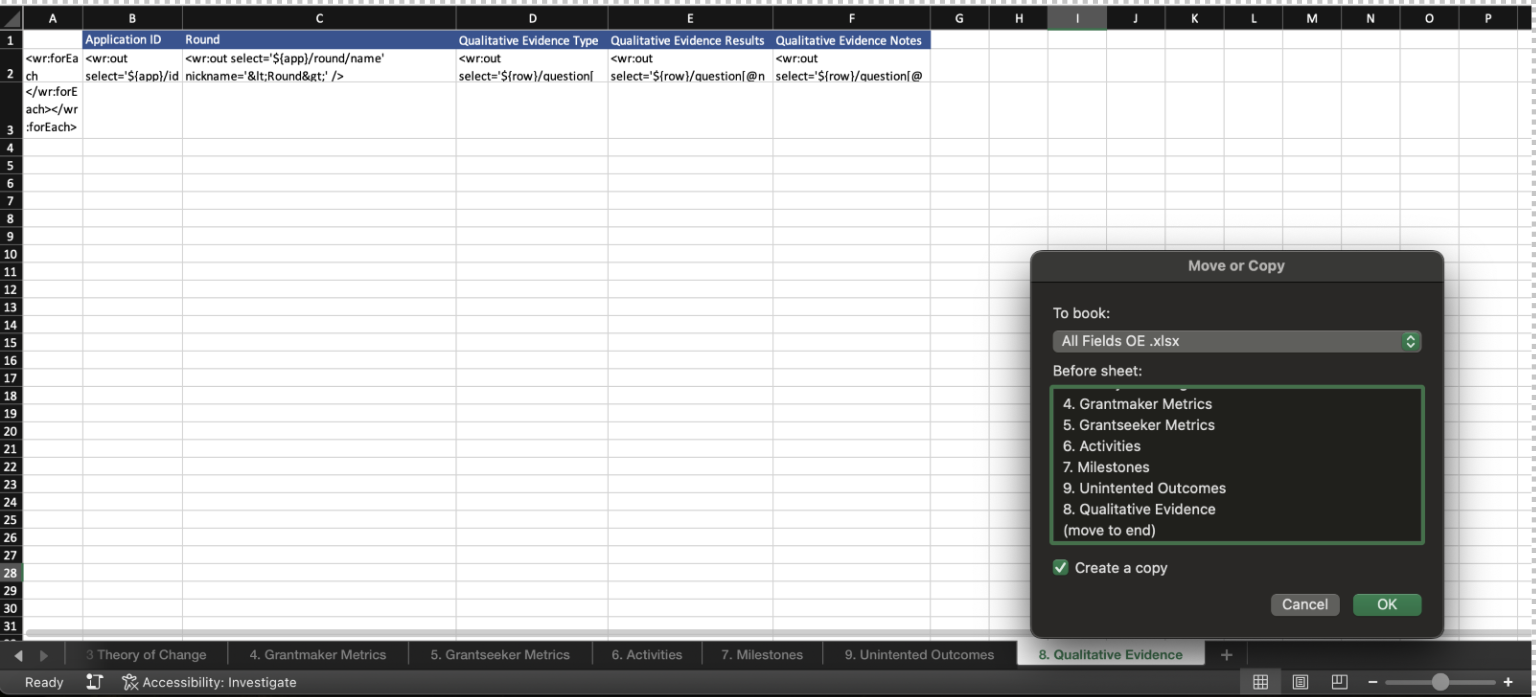
In the All Fields template, create a copy of the Qualitative Evidence tab by right clicking the tab in the bottom ribbon and selecting Move or Copy. In the window that appears, tick Create a copy and click OK. Rename the tab to the name of the custom standard section.
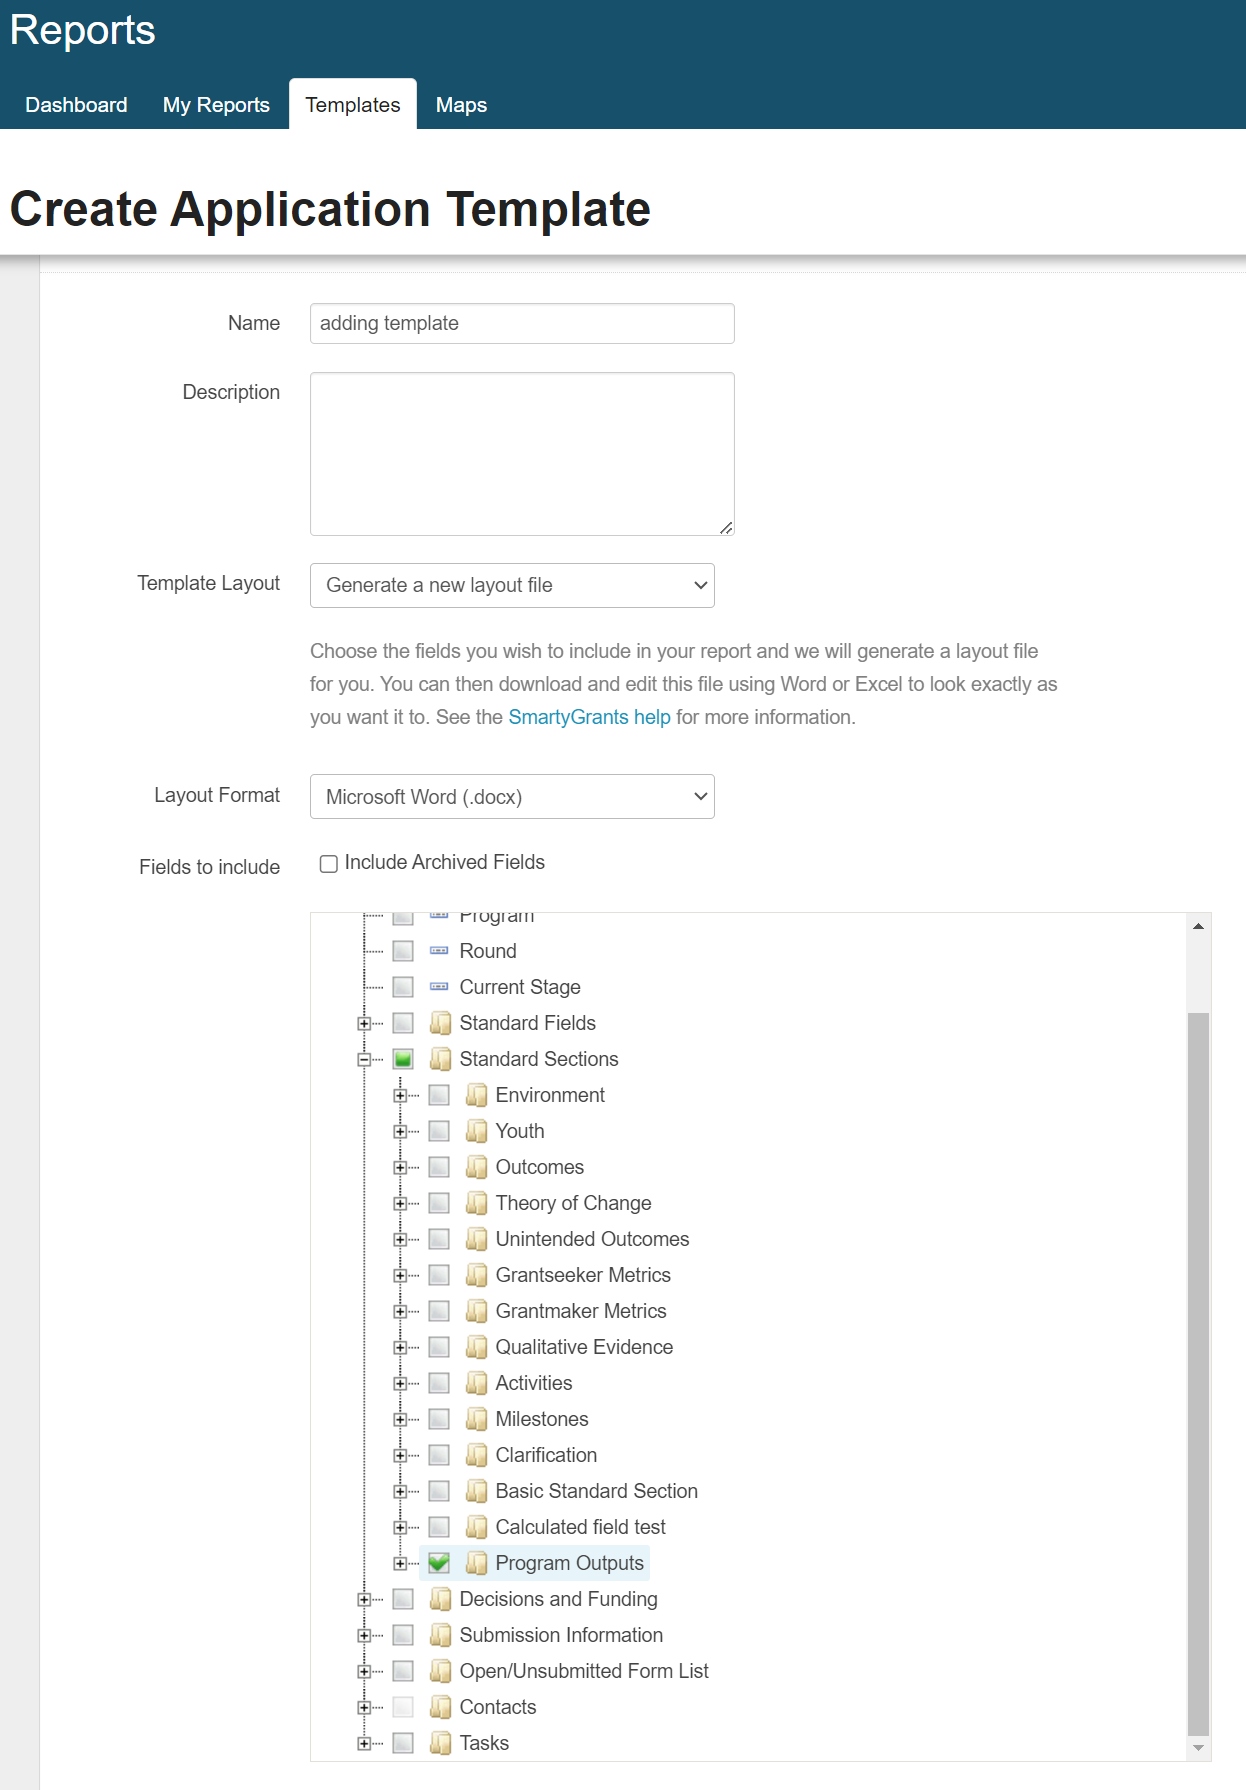
Adding a custom standard section to the All Fields report is similar to adding a custom standard field. Repeat Steps 1-3 of the previous section, only when selecting fields from the field tree to generate a report template, tick the custom standard section you would like to add to the report. You can tick multiple custom standard sections that you would like to add.
In this example, the custom standard section “Program Outputs” is selected. Download the template that is created.
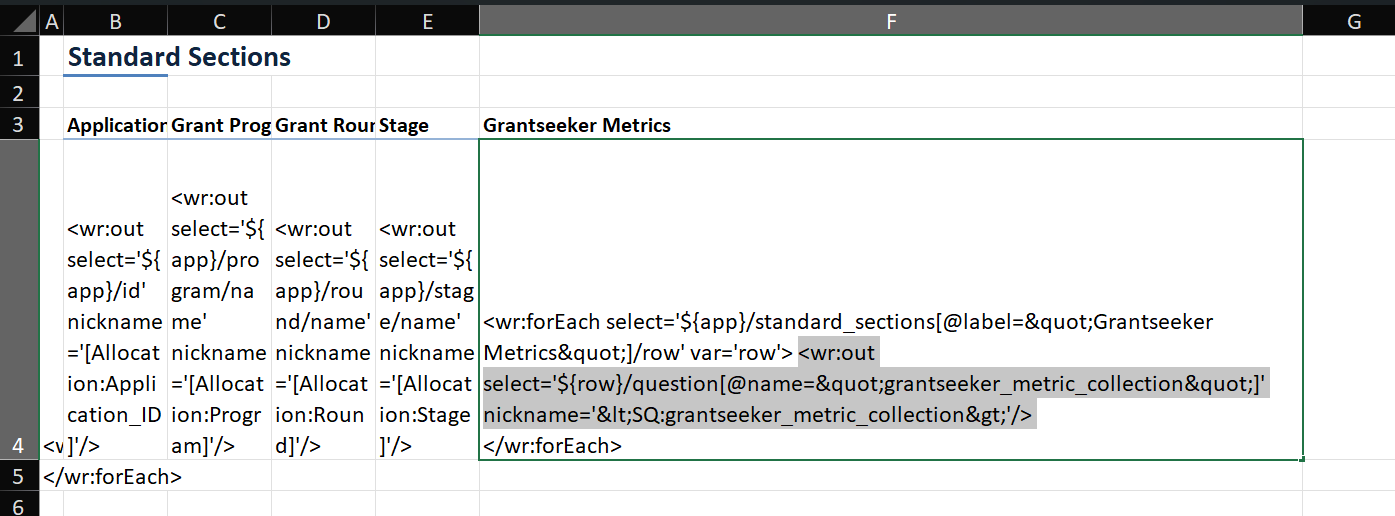
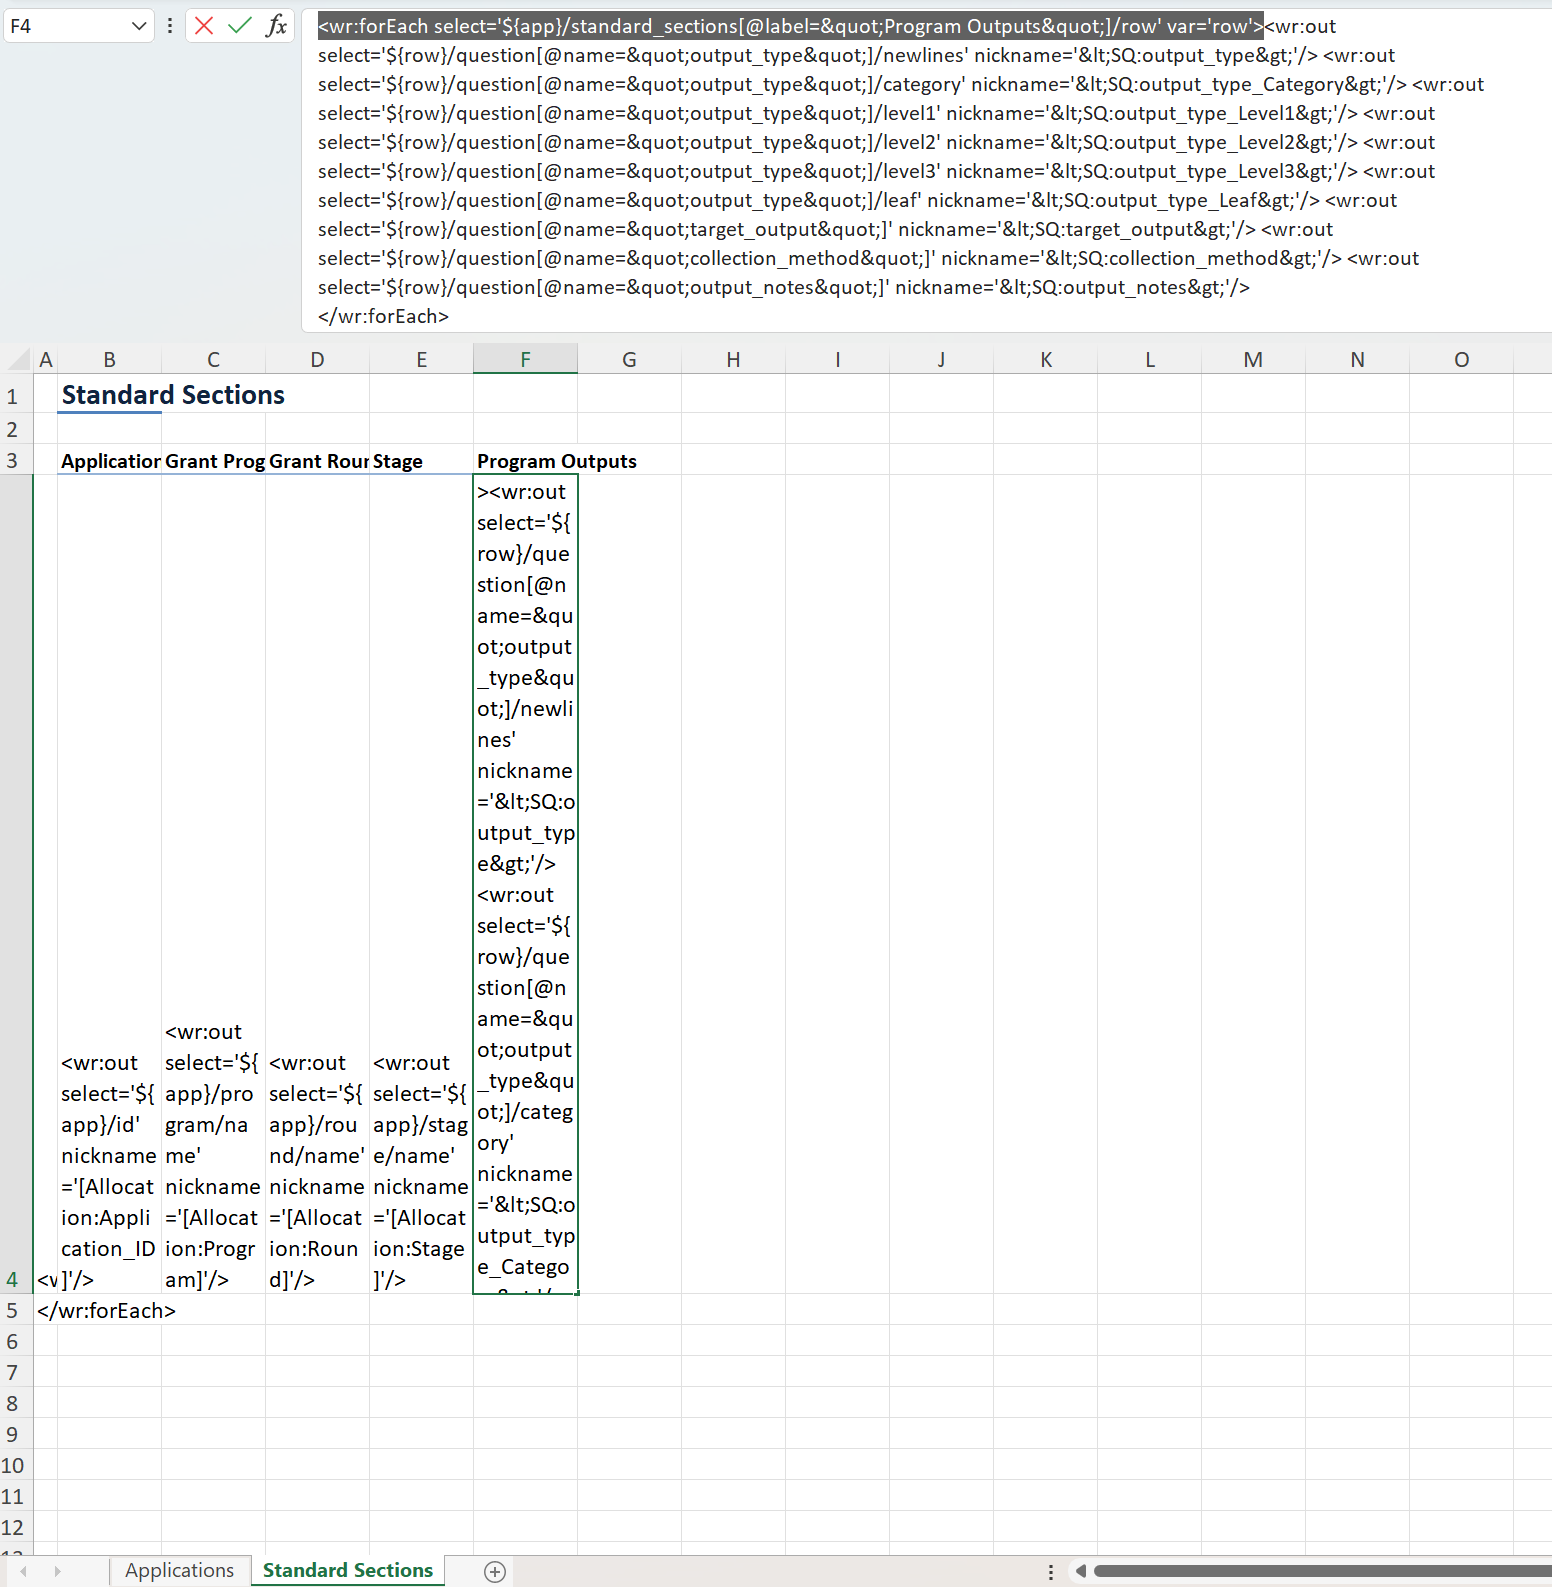
In the report template you downloaded, click on the tab Standard Sections. In the third row, there will be a cell with the name of the Standard Section you would like to add to the All Fields template. Click on the cell beneath that name. In the example below, the cell below Program Outputs is selected.
In that cell, there will be multiple code chunks, each within pointy brackets <>. For now, highlight and copy just the first chunk which begins with <wr:forEach and ends in >.
In the image below, only this first code chunk is highlighted.
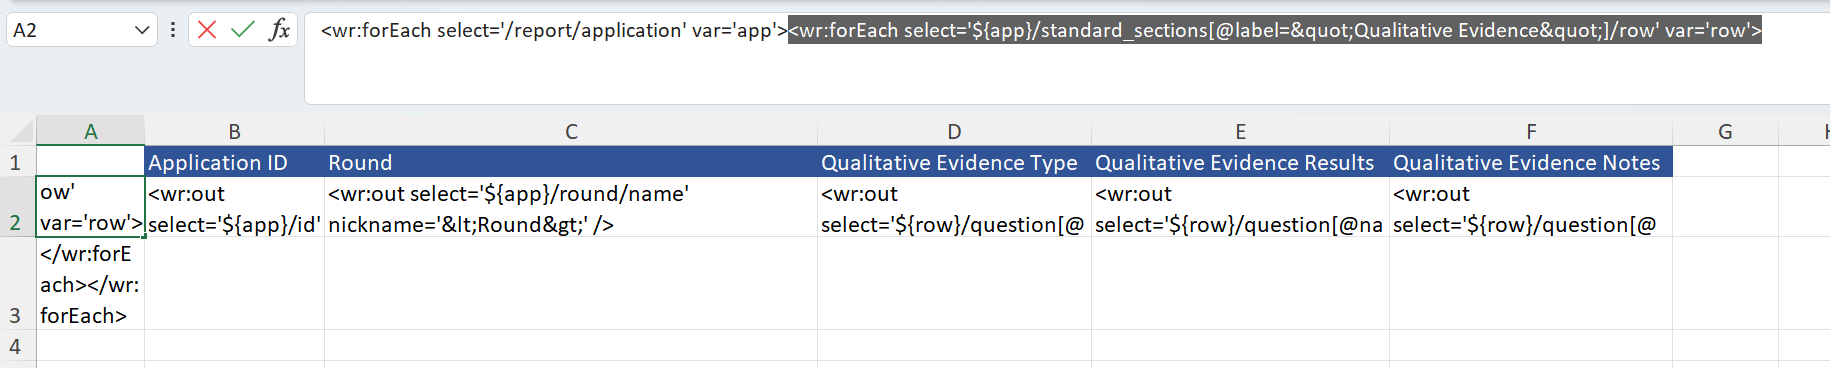
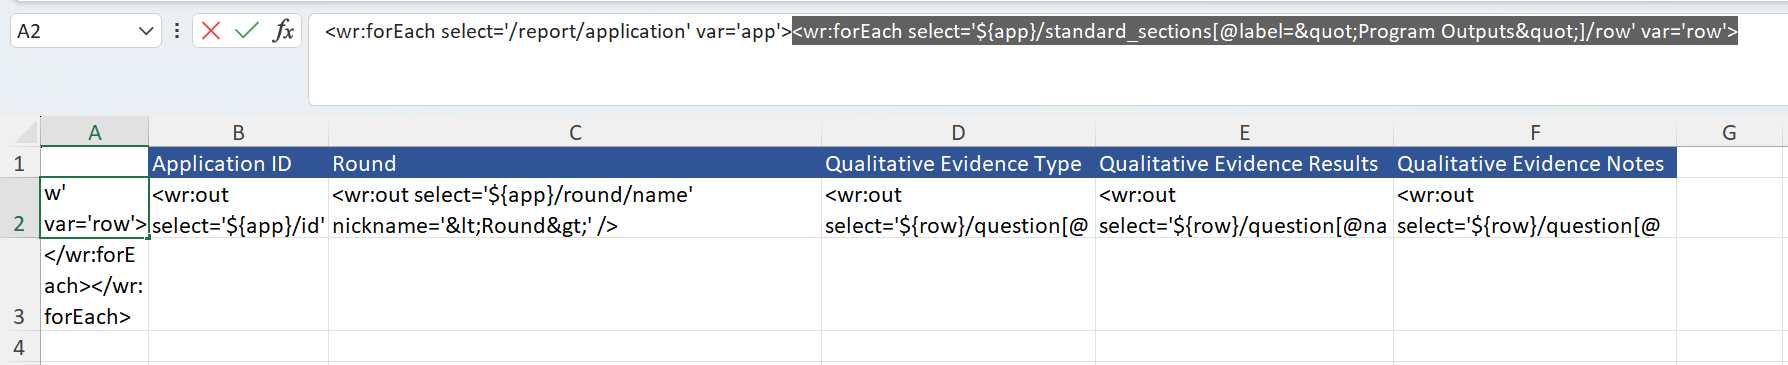
Navigate back to the tab you created in the All Fields template. Click on Cell A2. You will see there are two code chunks between pointy brackets. Select the second one and delete it.
Then, paste in the code chunk you highlighted in Step 3. You should have replaced the old code chunk beginning with <wr:forEach with another code chunk beginning with <wr:forEach. After @label= you should see the name of the custom standard section (i.e. Program Outputs).
In the blue header row, delete the column headers of fields from the Qualitative Evidence standard section and clear the cells below them too.
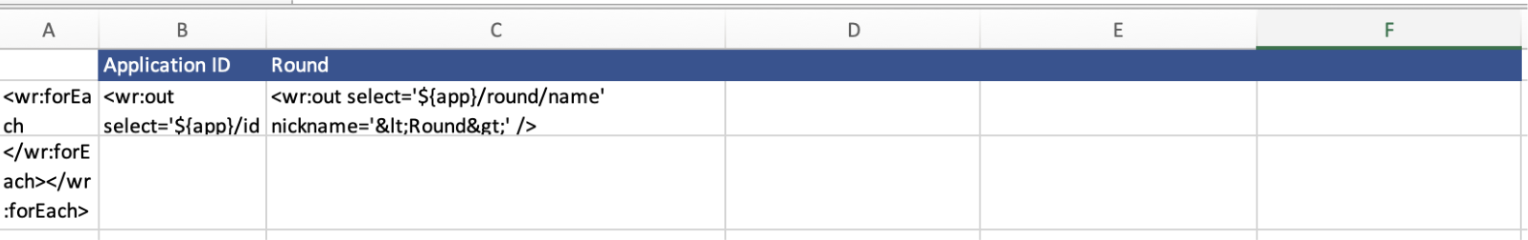
Add in a column header for each question in the custom standard section you would like to add to the report.
As an example, the questions “Qualitative Evidence Type”, “Qualitative Evidence Results” and “Qualitative Evidence ” have been added as column headers.
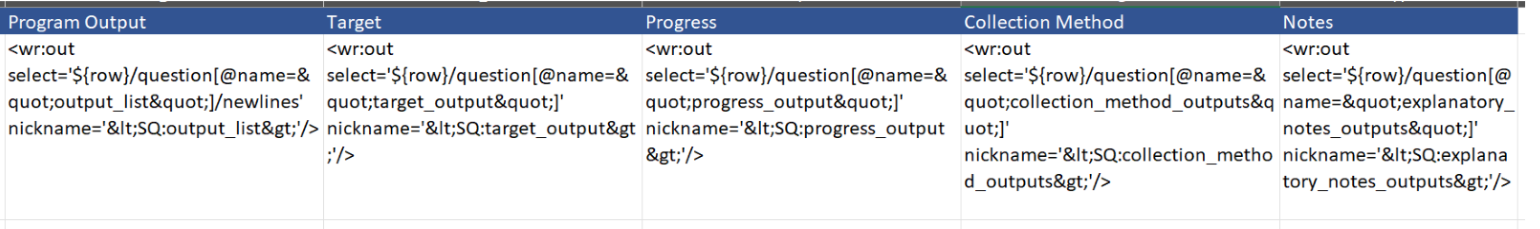
Navigate back to the downloaded report template and the same cell we previously copied a code chunk from. Below is all the code in that cell split out into code chunks. Besides the first and last code chunk, each code chunk between pointy brackets <> corresponds to a question in the standard section (and generates responses to that question). Below, the green and red chunks relate to the questions.
<wr:forEach select='${app}/standard_sections[@label="Program Outputs"]/row' var='row'>
<wr:out select='${row}/question[@name="output_list"]/newlines' nickname='<SQ:output_list>'/>
<wr:out select='${row}/question[@name="output_list"]/category' nickname='<SQ:output_list_Category>'/>
<wr:out select='${row}/question[@name="output_list"]/level1' nickname='<SQ:output_list_Level1>'/>
<wr:out select='${row}/question[@name="output_list"]/level2' nickname='<SQ:output_list_Level2>'/>
<wr:out select='${row}/question[@name="output_list"]/level3' nickname='<SQ:output_list_Level3>'/>
<wr:out select='${row}/question[@name="output_list"]/leaf' nickname='<SQ:output_list_Leaf>'/>
<wr:out select='${row}/question[@name="target_output"]' nickname='<SQ:target_output>'/>
<wr:out select='${row}/question[@name="progress_output"]' nickname='<SQ:qualitative_evidence_type>'/>
<wr:out select='${row}/question[@name="collection_method_outputs"]' nickname='<SQ:qualitative_evidence_results>'/>
<wr:out select='${row}/question[@name="explanatory_notes_outputs"]' nickname='<SQ:qualitative_evidence_notes>'/>
</wr:forEach>
Note the code chunks in green relate to the SmartChoice list. If you have only used Level 1, copy and paste the green bolded section below and put under the ‘Program Output’ heading in the All Fields report.
Paste the code chunk in the All Fields report in the cell below the corresponding column header. Repeat Steps 8 and 9 until you have filled out the code chunks for every question the standard section you wanted to add to the report.
Save your changes to the template. This template is ready to be uploaded into SmartyGrants.
If you selected multiple custom standard sections from the field tree in Step 2, you can duplicate the Qualitative Evidence tab and repeat steps 3-9 until all custom standard sections have been added to the template.
You can upload the template as a new template by returning to Reports and the Templates tab. Select Create Template > Select Multi-Program Template again. This time however, for Template Layout select “Upload an existing layout file” and upload your edited All Fields template.
Progress Reports
What is multi-year (quarter/month/week) reporting and when would you want it?
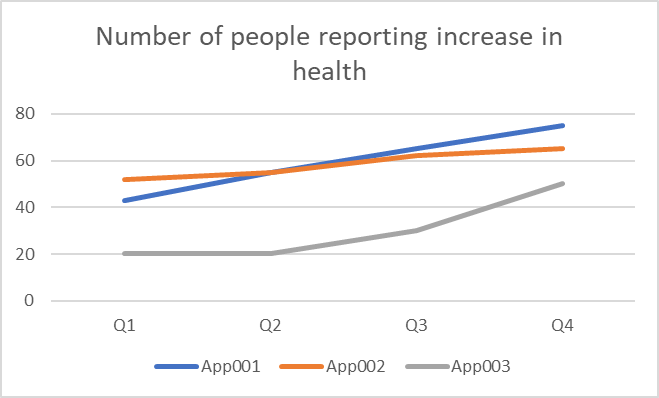
You may require multiple progress reports if the grant goes over 12 months. Collecting multiple data points allows you and the grantee to track progress over time. See the graph below as an example of quarterly reporting of the number of people reporting an increase in health.
The SmartyGrants Outcome Engine provides a ‘progress’ field for Grantseeker and Grantmaker Metrics. However, the field only appears once i.e. there are no progress 1, progress 2, or progress 3 fields.
To create the above graph or table such as these:
| Number of people reporting improvement in health to date | |||||||
| 2022 Q1 | 2022 Q2 | 2022 Q3 | 2022 Q4 | 2023 Q1 | 2023 Q2 | 2023 Q3 | 2023 Q4 |
App0001 | 20 | 50 | 70 | 100 | 120 | 150 | 170 | 200 |
App0002 | 10 | 25 | 50 | 100 | 140 | 160 | 210 | 220 |
or
| Number of people reporting improvement in health per quarter | |||||||
| 2022 Q1 | 2022 Q2 | 2022 Q3 | 2022 Q4 | 2023 Q1 | 2023 Q2 | 2023 Q3 | 2023 Q4 |
App0001 | 20 | 30 | 20 | 30 | 20 | 30 | 20 | 30 |
App0002 | 10 | 15 | 25 | 50 | 40 | 20 | 50 | 10 |
We recommend that you set up your forms in SmartyGrants to support the collection and reporting of this data.
Setting up your forms in SmartyGrants for progress reporting
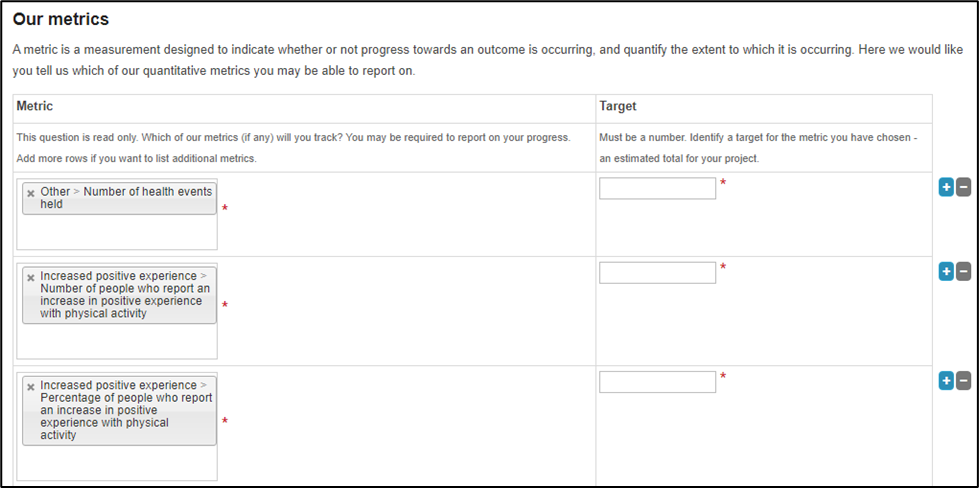
Create an Application form and use the “Grantmaker Metrics” Standard Section or/and “Grantseeker Metrics” Standard Section. Hide the progress field and other fields if not required.
2. Create a Progress report form and use the “Grantmaker Metrics” Standard Section or/and “Grantmaker Metrics” Standard Section. Hide any fields not required.
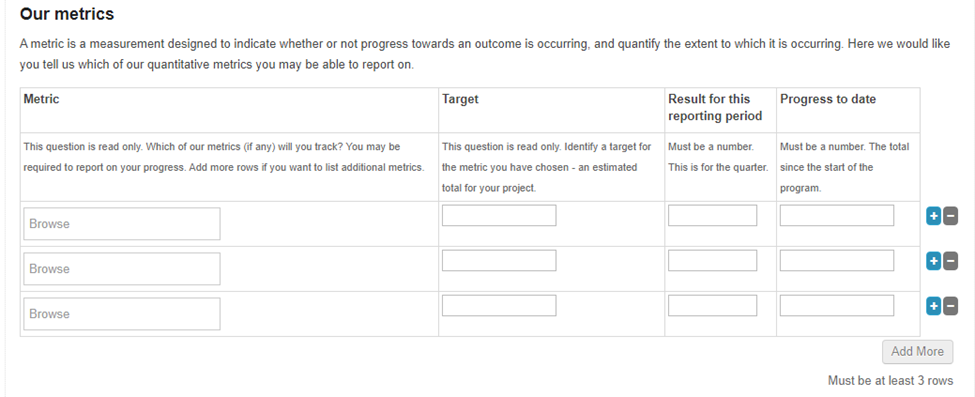
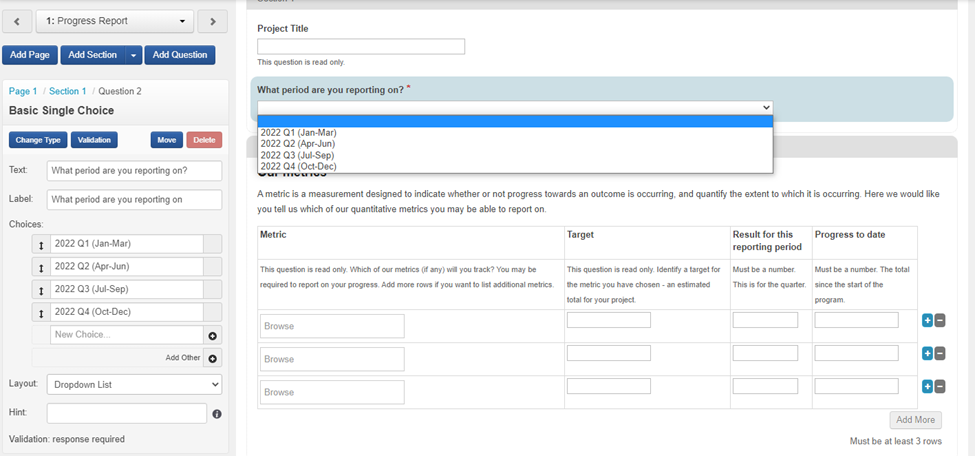
3. Change ‘Progress’ to ‘Progress to date’ and add a “Result for this reporting period” question into the Standard Section. (Why? This helps grantees distinguish between data for the quarter and cumulative data which is what we want in the “progress to date” standard field).
4. Use this ‘Progress Report’ as your standard, that is use it repeatedly. To do this append the same report multiple times to the acquittal tab.
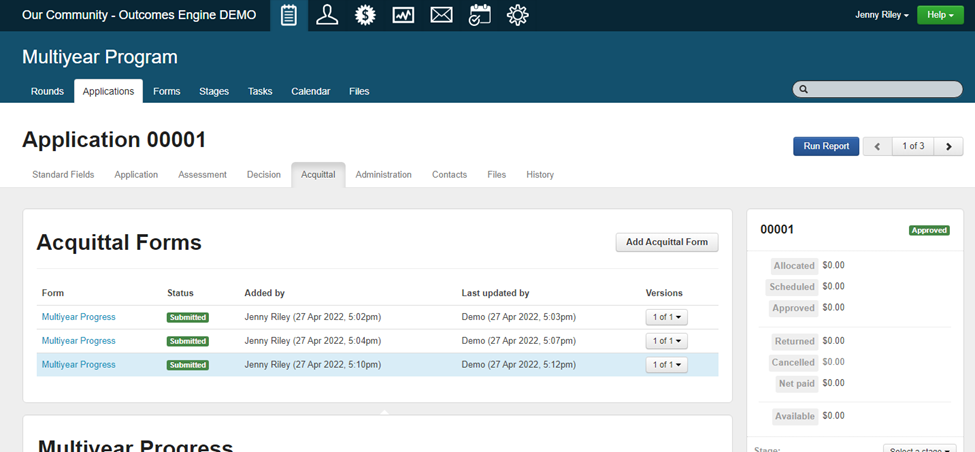
5. So that you know what period is being reported on add a mandatory question “What period are you reporting on?” and add a drop-down menu for the reporting period:
The Progress report form looks like this for the Grantee (note the Target comes across from the application) but the other columns are empty in the first progress report.
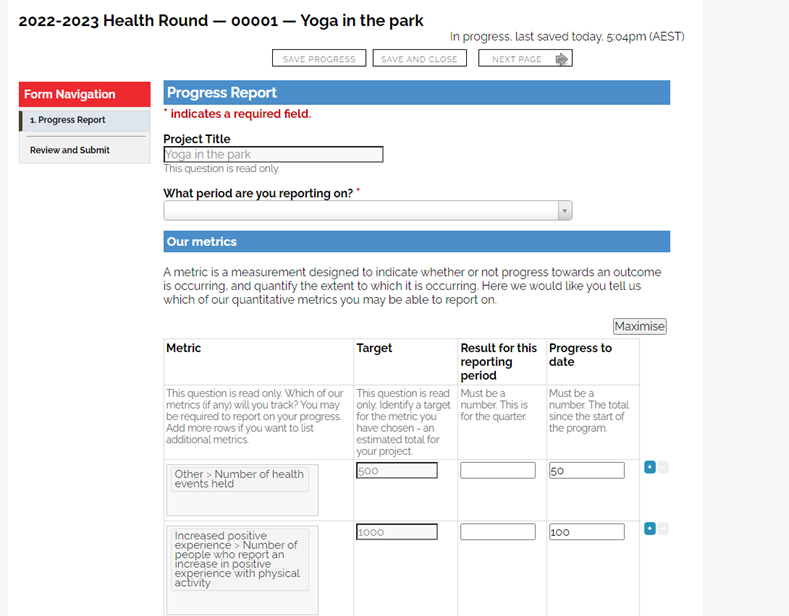
When the applicant gets the second progress report, they will need to select the second reporting period AND they will need to update the progress to date data (which will automatically come through from the first progress report).

If the Grantee was reporting 100, 100 and 70 respectively for the Second Quarter it will now look like this:
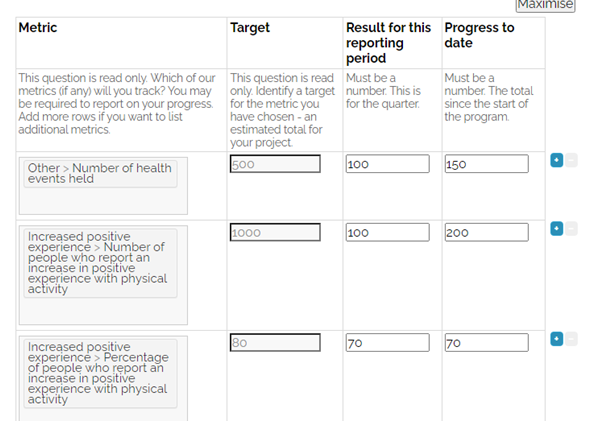
Note: They will have to manually calculate the progress but this is progress to date plus the new data i.e. 100 (last progress to date) plus 50 for this quarter = 150 progress to date.
How to produce a progress report?
Download this template below:
Upload this template and run the report (see the first 5 steps in the All Fields Report above on how to upload a template).
Third-Party Reporting Software
There are a number of third-party software options available to assist organisations report and showcase their data.
Applications such as Canva provide templates for infographics or glossy reports. Here is an example of a report we created using Canva.
We are often asked about how to connect to data visualisation applications such as Microsoft PowerBI or Tableau or YellowFin.
There are two approaches to connect SmartyGrants and Power BI:
Using scheduled reports (Excel) and Microsoft 365 to build a data pipeline to Power BI
Connecting Power BI directly to the via our OData APIs or other SmartyGrants APIs.
Guidance on connecting OData to Power BI can be found in our documentation here. For guidance contact the SmartyGrants Support Team for a copy of the guides.
Note: The SmartyGrants APIs were designed for systems integration rather than reporting, and there are some limitations with regards to data coverage and usability. In most use cases, we’d recommend using OData for this purpose instead.
Note: The OData integration requires an additional subscription fee. Please see our Pricing page for details. To have OData enabled on an instance, administrators can contact the support team at service@smartygrants.com.au.
Below we have provided some simple instructions on how to connect the All Fields report to Microsoft PowerBI as an example of how you may connect to Third-Party software.
Connecting the All Fields Report to Microsoft PowerBI
Save your data report securely in a OneDrive or on Sharepoint or other location. If you want to use the data we have used for this example download the All Fields xls below
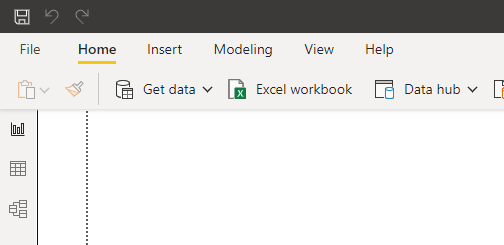
2. Open the Microsoft PowerBI desktop application (downloadable from Microsoft).
3. In the top left-hand corner select Excel workbook.
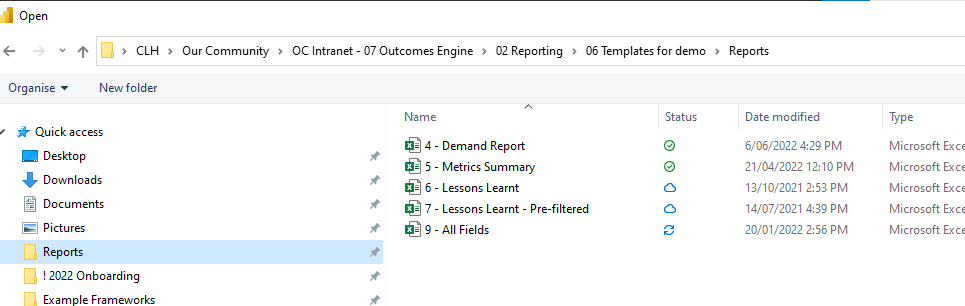
4. Select the All Fields report from your Windows Explorer.
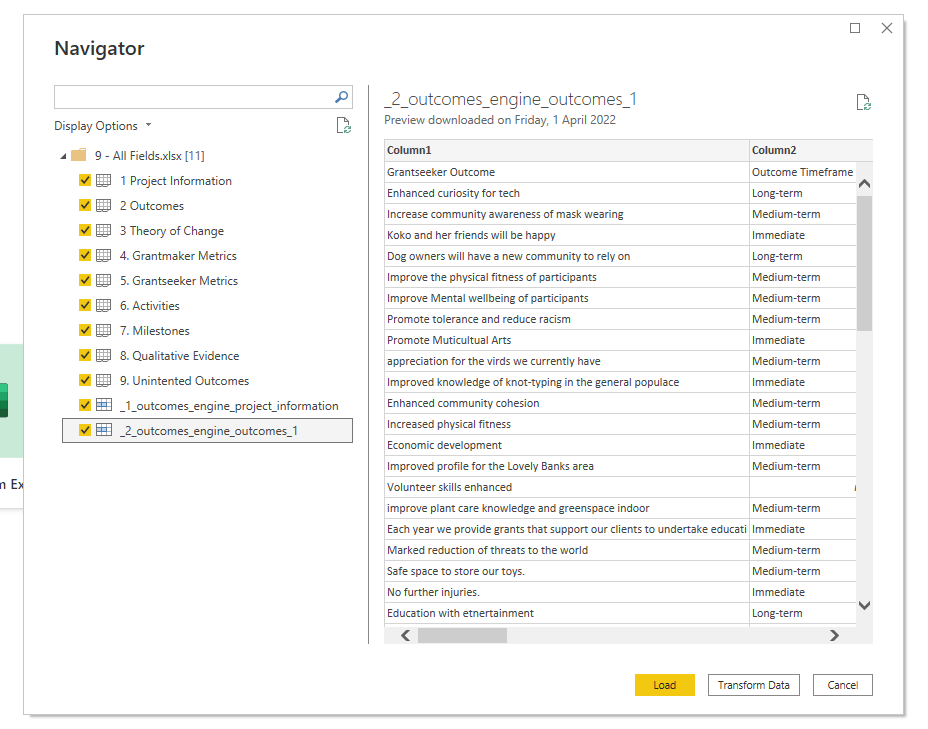
5. Select all the sheets in the Navigator and select Load.
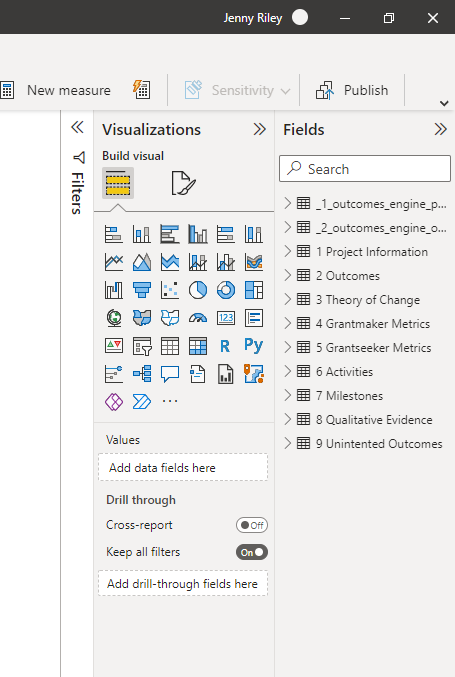
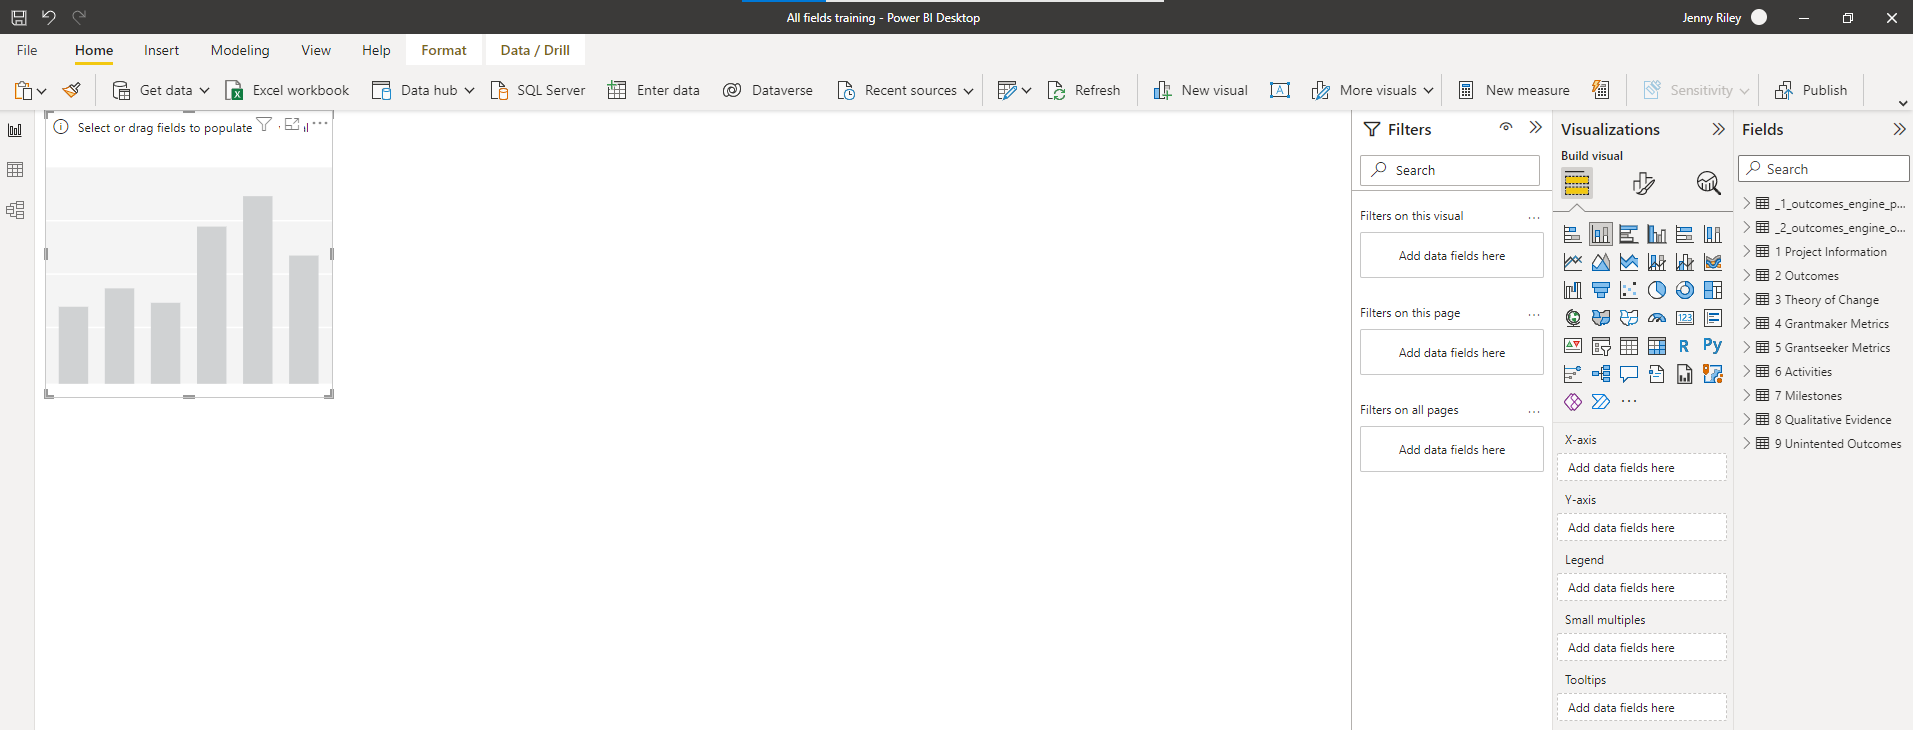
6. You will see all the sheets and fields now appear to the right of the screen.
7. Save your work! (Go to the File Menu and select Save As)
How do I make a dashboard?
First, make sure that your data model is set up by going to the third option down on the left-hand menu called “Model”.
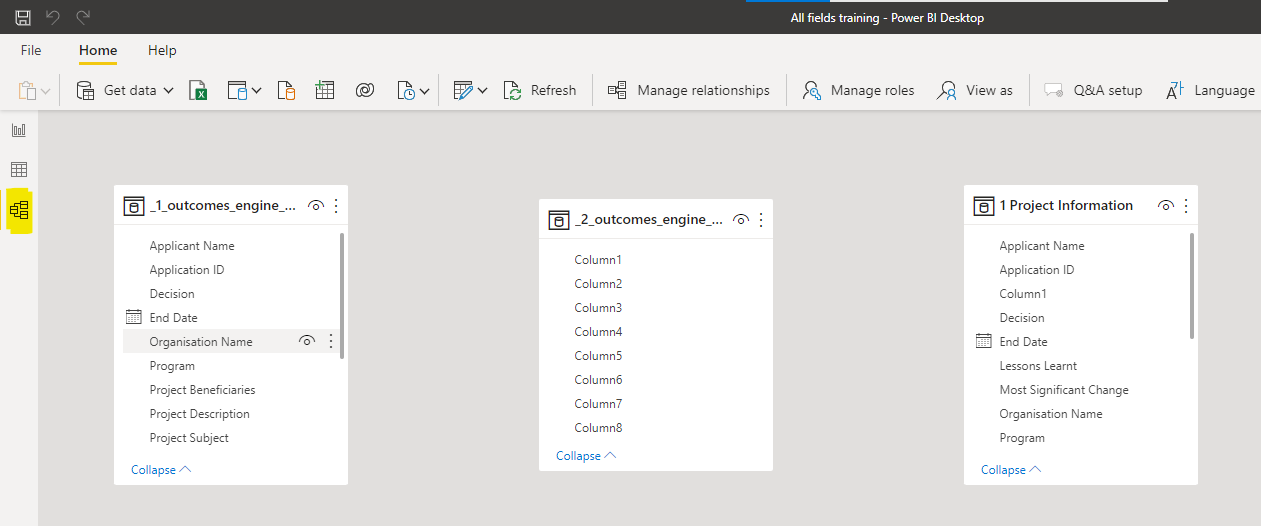
2. Select the Project Information table by clicking on it and then select manage relationships from the top menu.
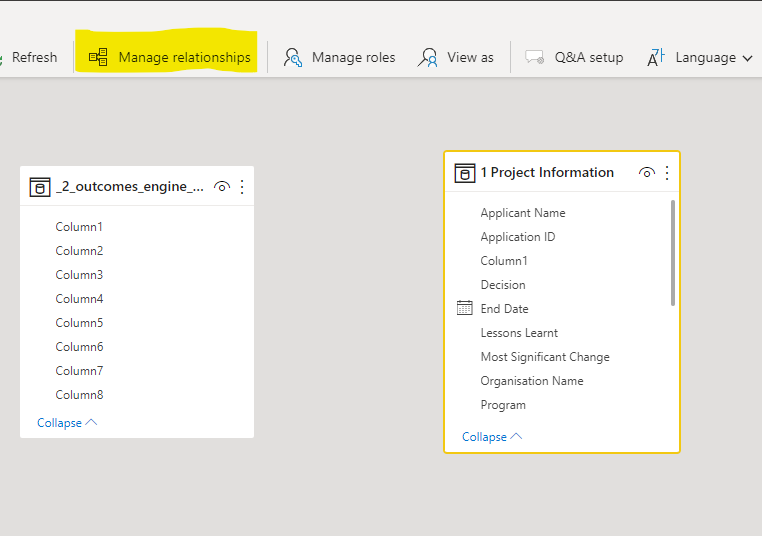
3. Select New…
4. In the first drop down menu select Project Information and select the column ApplicationID and in the second drop down select Grantmaker Metrics and highlight ApplicationID. In Cardinality select Many to Many and hit OK.
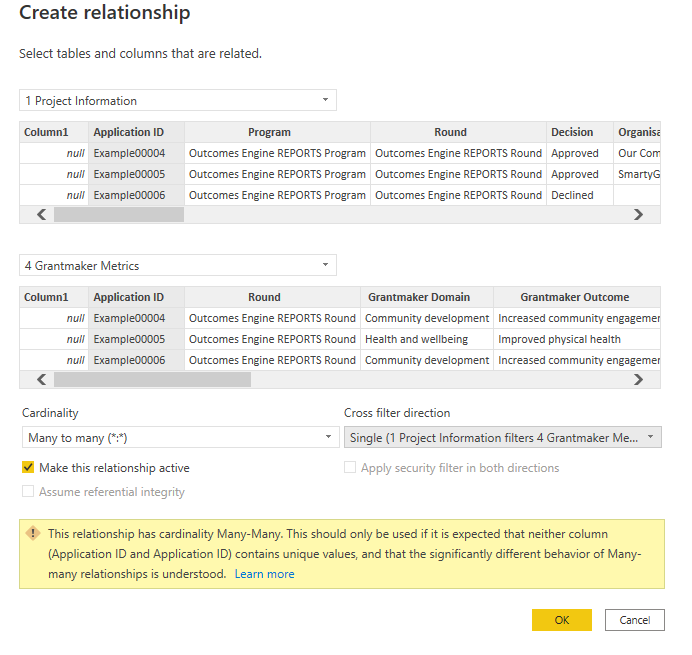
5. Select Close.
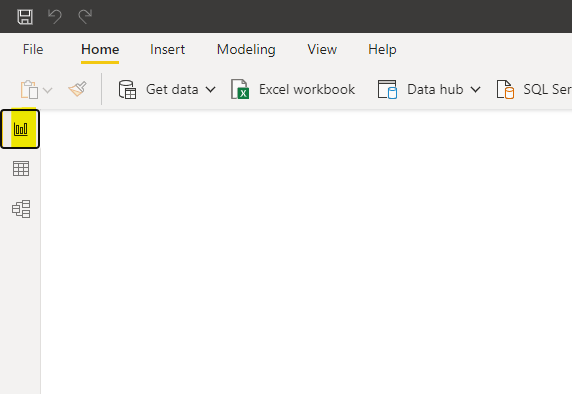
6. Return to the Report page by selecting the Report icon on the left-hand menu.
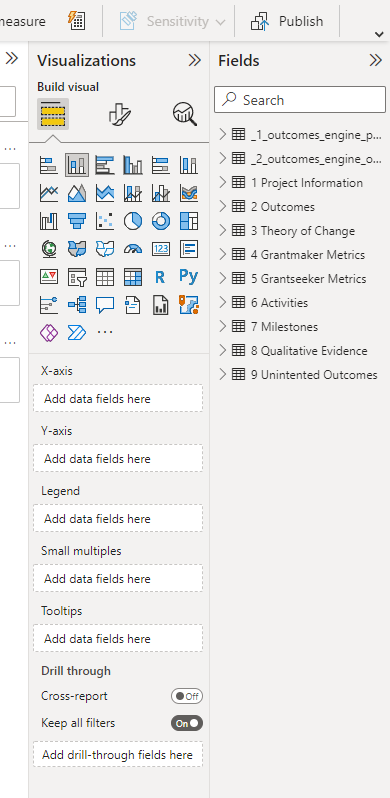
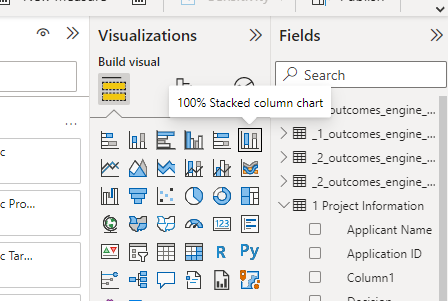
7. Select your first visualisation type from the Visualisation menu on the right by clicking on “Stacked column chart”.
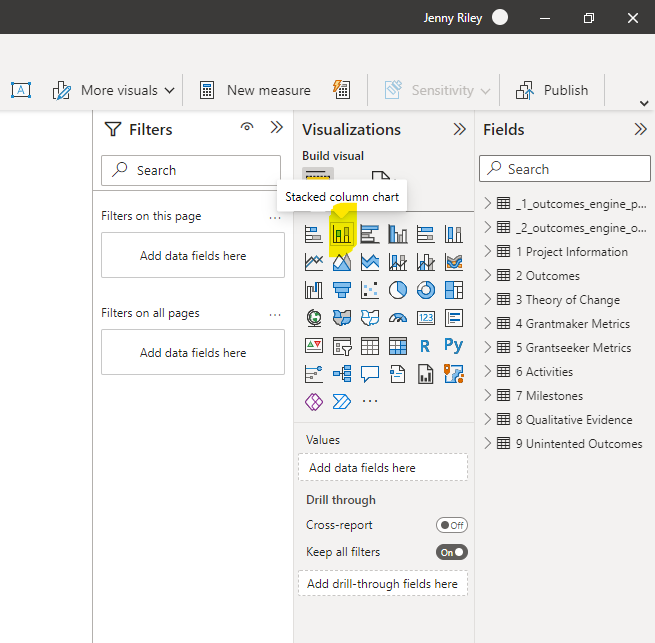
8. A grayed-out visual will appear as a ‘Tile’ on the ‘Canvas’. You can drag this to where you want.
9. To tell PowerBI what you want to see in that visual, you use the Build Visual and Fields menus on the right.
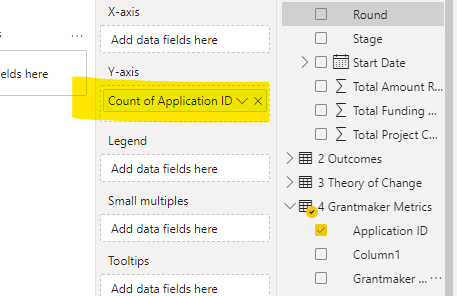
10. Select the 4 Grantmaker Metrics drop-down and select the “ApplicantID field”.
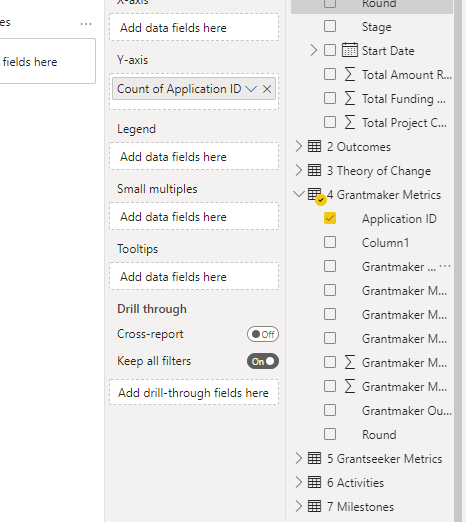
11. Drag this into the Y-axis box.
12. Then select Grantmaker Domain.
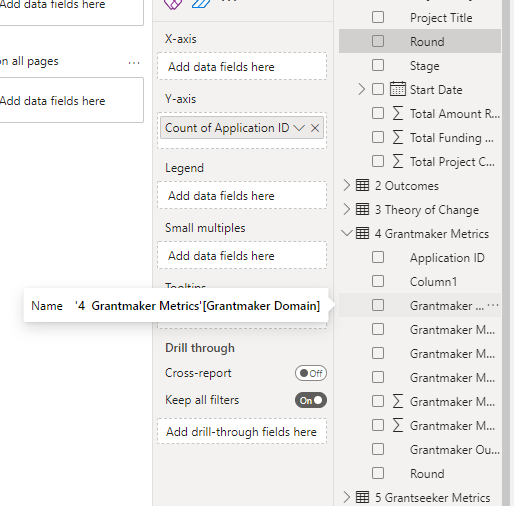
13. Drag this to the X-axis box.
14. Note the change to the visualisation.
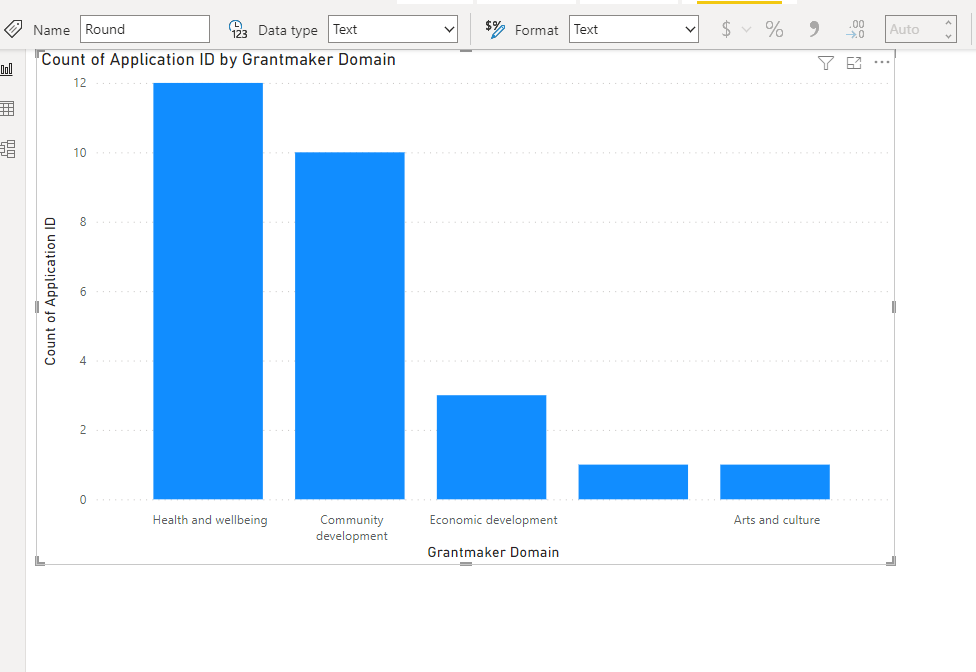
This shows you how many applicants are reporting outcomes in each of your outcome domains. This graph is also useful for helping you ‘sort’ the other graphs - see step 19.
15. To make the visual smaller, grab the bottom right-hand corner of the image and pull towards the top left. Select off the visual by clicking anywhere on the canvas. Now you can do another visual.
17. Select Stacked Column Chart again, this time drag Grant Maker metric to the X-axis and Grantmaker Metric Progress and Grantmaker Metric Target into the Y-Axis.
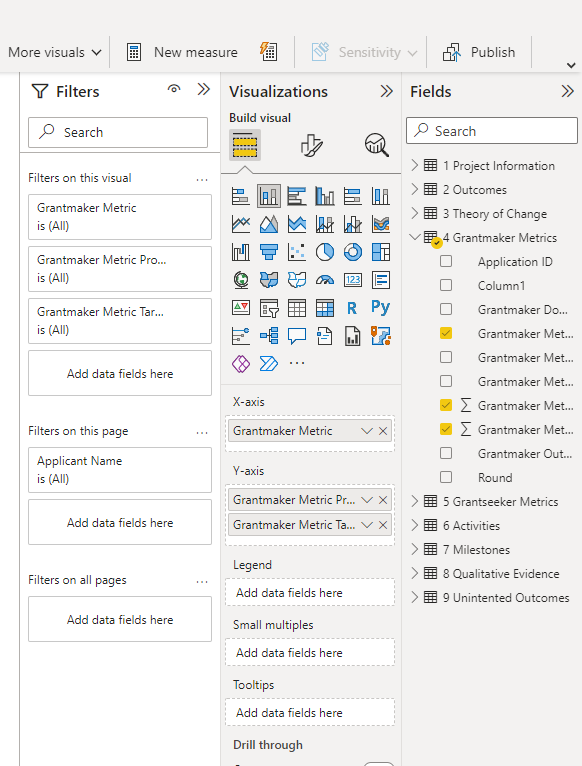
18. Your visual should look like this:
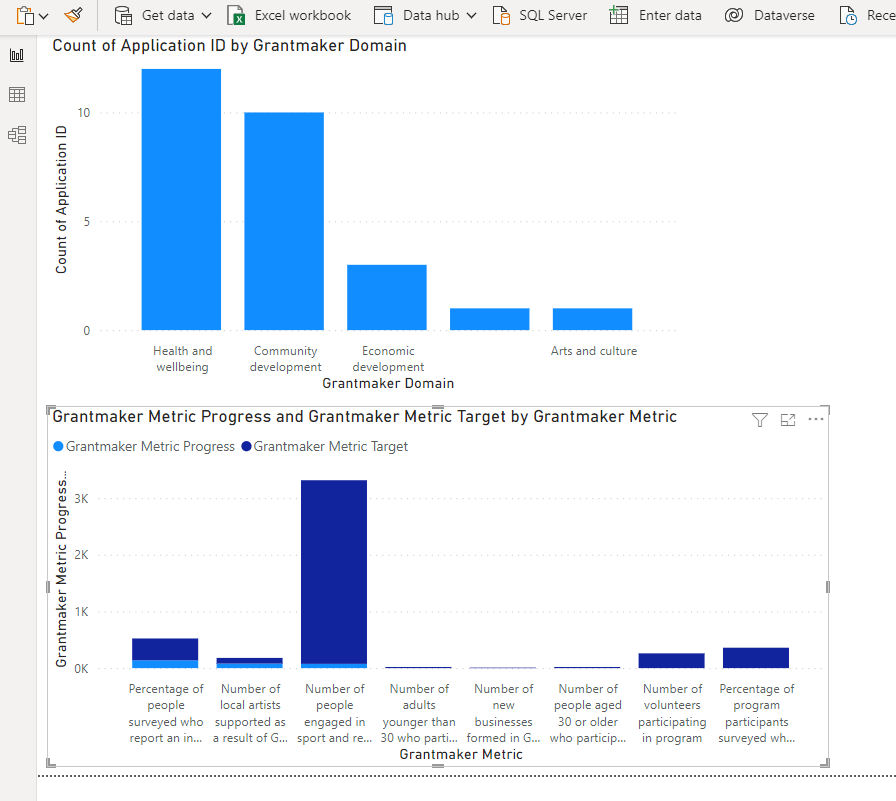
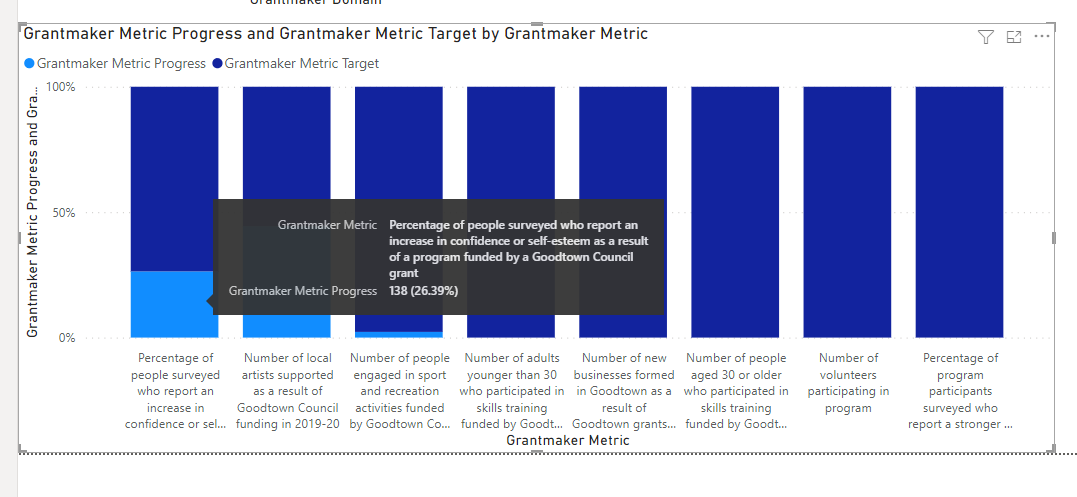
So what does this tell you? So far your grantmakers have yet to reach their targets! If you want to see these as percentages simply select the 100% Stacked column chart visualisation.
Your visual should update, not if you hover over parts of the graph you will see a tool tip. We can report that 26.39% of people surveyed (so far) have reported an increase in confidence or self-esteem as a result of this grant.
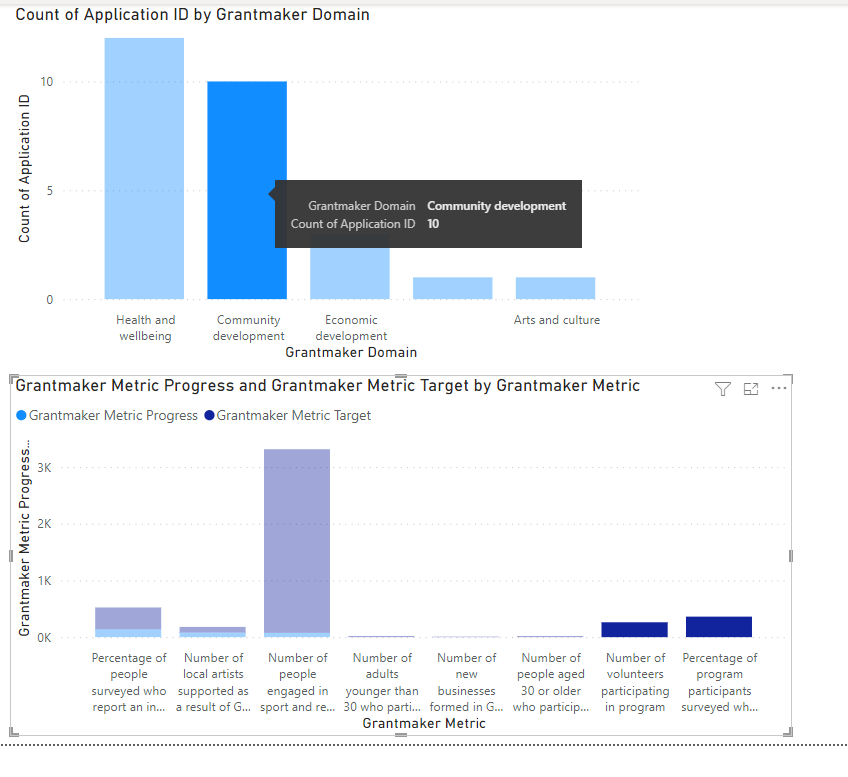
19. Note that if you select one of the domain columns in the top visualisation it will sort the relevant data in the second visual.
20. ‘Great', you say, 'but I want to know which of my grantees is providing the outcomes’. On a new page, select a stacked bar chart. Drag the Applicant Name (from Project Information table) into the Y-Axis and Grantmaker Metric Progress and Grantmaker Metric Target into the X-Axis.
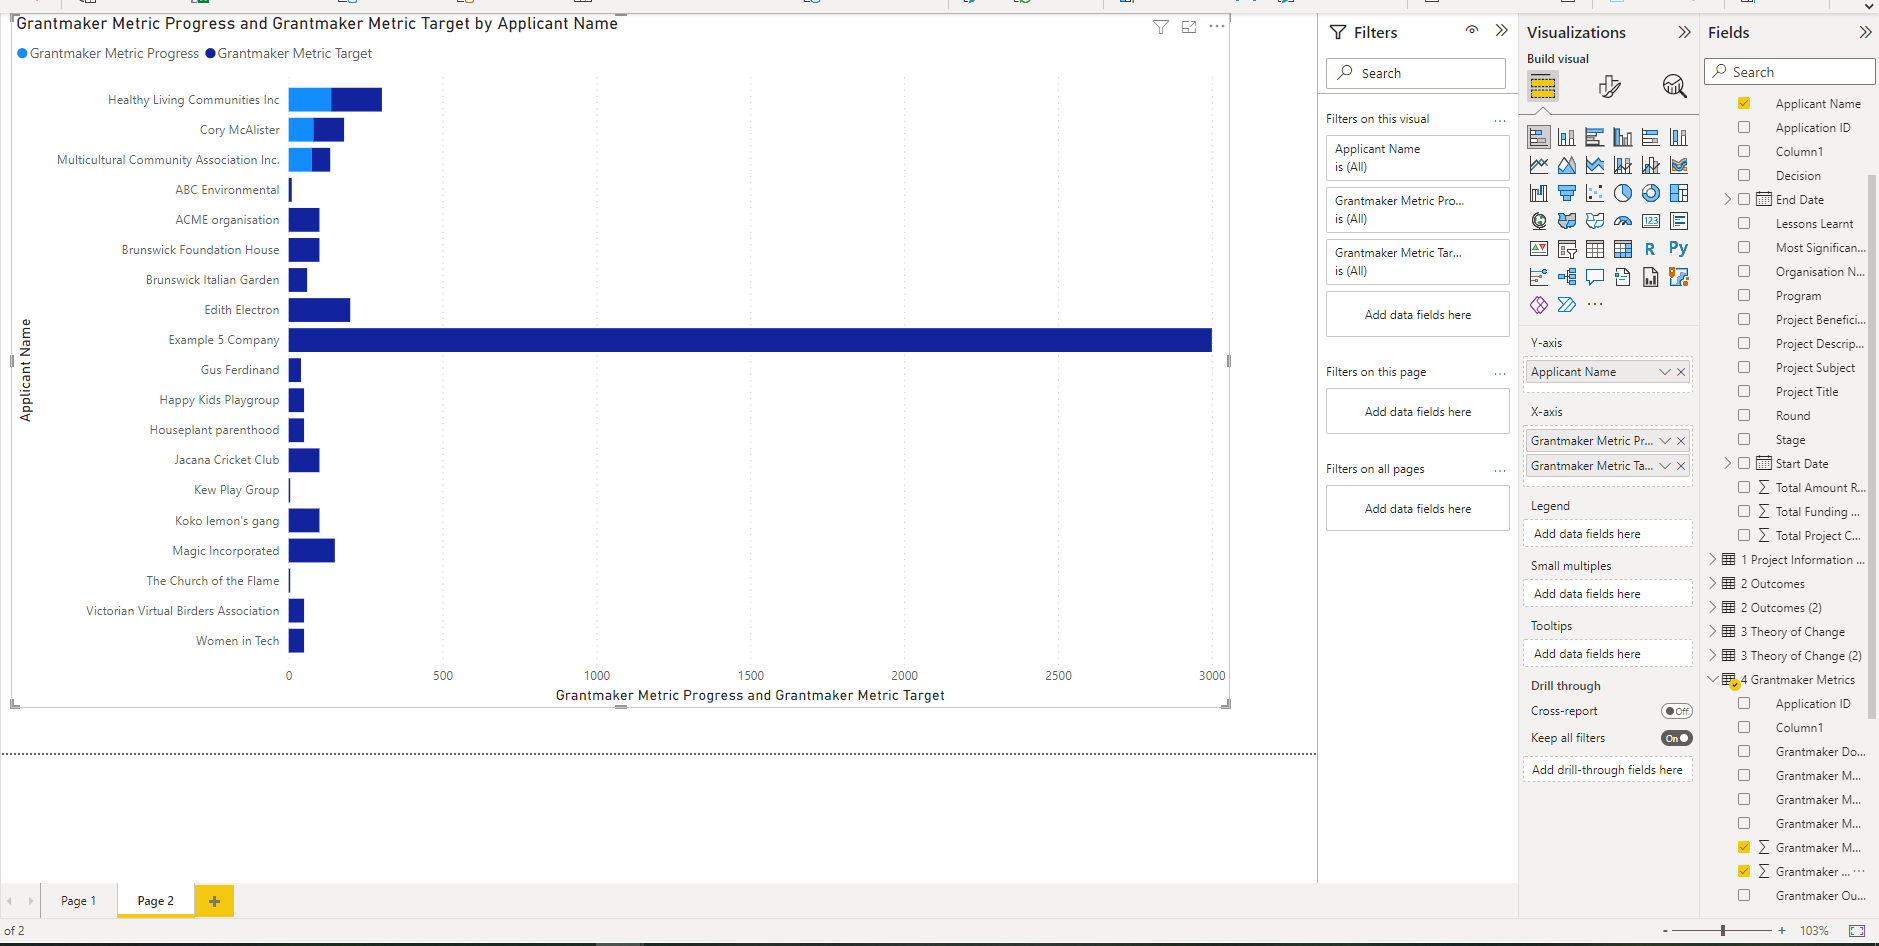
There is so much more you can report. We will keep adding ideas and tricks and tips on this page. Best thing is to start exploring your data!
Further help
Contact the SmartyGrants Support Team to talk to our consulting team to discuss services to create tailored reports for you.