SmartyGrants Maps
Important: |
In May 2025, we launched SmartyGrants Analytics – a powerful reporting tool that enables dynamic dashboards and rich data visualisations, including upgraded mapping capabilities. This is a major leap forward from SmartyMaps. It enables:
|
Given these advances, we’ve made the decision to discontinue the existing SmartyMaps feature as of July 31, 2025. Learn more about SmartyGrants Analytics. |
This feature is relevant to Australia and New Zealand Accounts only.
SmartyGrants Maps will unlock powerful insights about your funding patterns, showing you where your grants applications are coming from, and to where your money is flowing. SmartyGrants Maps will help you visualise and make sense of your grants data and facilitate better-informed decision-making.
This Mapping feature allows you to analyse your data by Australian Federal Electorate, State Electorate, Local Government Area, Remoteness Area, State, Postcode, Suburb and New Zealand Regional Council and Territorial Authority.
This information can be based on a project location or on applicant primary address information.
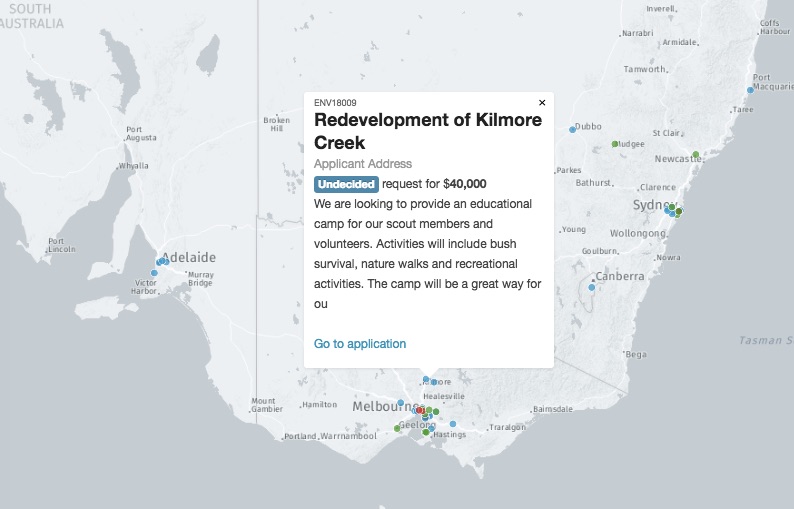
Maps can display undecided, approved or declined applications, along with clickable popup displays of total amount requested, project title etc...
Use the SmartyGrants Maps dashboard to:
Visualise your grants in the context of a range of geographic boundaries
Take a bird's eye view of your grants across a wide region or zoom in on a particular point with pin-point accuracy
Generate insights about over/under-funded regions or areas that are over/under-represented in application stats
View heat maps that reveal contextual insights about your data
Along with the ability to map you can also Lookup electorate information State & Federal plus Local Government Areas and Remoteness Area. These fields though added to a form do not have to be displayed - these fields can remain hidden if specified.
Table of contents
How do locations appear on the map?
There are 2 types of addresses that will appear on the map; an Applicant Primary Address and any other address that you specify as being a Project Location. Project Locations are displayed as points on the map, but aren't counted in any boundary statistics.
Addresses are questions that are added to a form. Once you select Add Question, 3 tabs appear and you have the option to add either Standard fields, Contact fields and Single Questions. Addresses can either be contact fields or single questions depending on what extra functions you need these addresses to do.

Contact fields populate a contact record in the contact directory on submission of an application, using a Single Question address will not populate a contact record in the directory. See contacts to learn more.
Applicant Primary Address is a field added via the Contact Field tab. This will populate a contact record on form submission and validated addresses will automatically appear on the map.
Project location is an option that can be selected on any address in a form. No matter how you chose to add this address to the form you have the ability to specify if this address is a project location or not is the side panel.
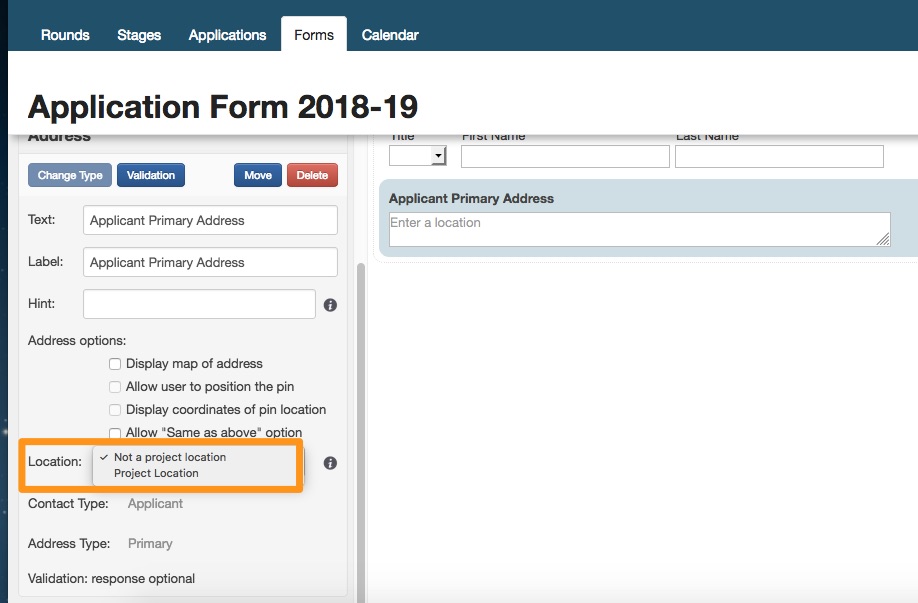
When viewing the maps dashboard you will see the option to view both or either Applicant Primary Address or Project Locations, as well as by decision status.

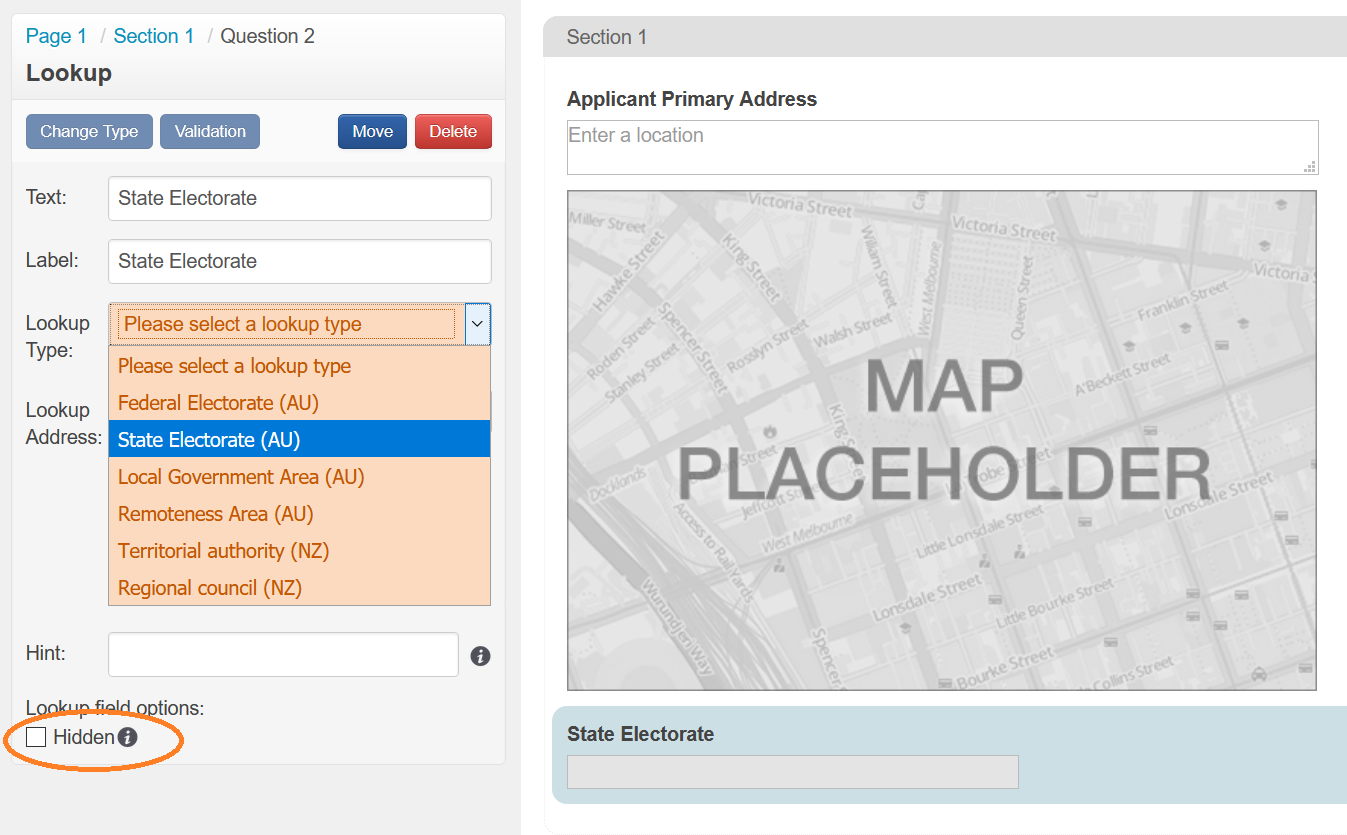
Lookup Question
You have the ability to add Lookup questions to your forms as a Single Question. Administrators can also add a Lookup question as a Standard Field for more information see how to add a Standard field.
This lookup field can link to any of the addresses built within that form and will lookup any of the following:
Australia
Federal Electorate
State Electorate
Local Government Area
Remoteness Area
New Zealand
Territorial Authority
Regional Council
The lookup field also has the option to be hidden from applicants, however, you can still opt for this field to be displayed. Either way, the field will collect the relevant information from the relevant data source and is a reportable field.

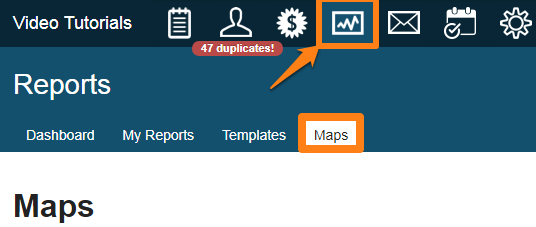
Map Display
Located within the reports area, you will see a Maps tab. This Map will display a geographical map as well as project information. Showing a green dot for applicant address where the application was funded and red dot where the application was not funded. This will allow you to see at a glance geographical areas that have received funding and those places that have not.
Maps can be filtered by Program, Round and/or Submission Date and customised to show the below options:
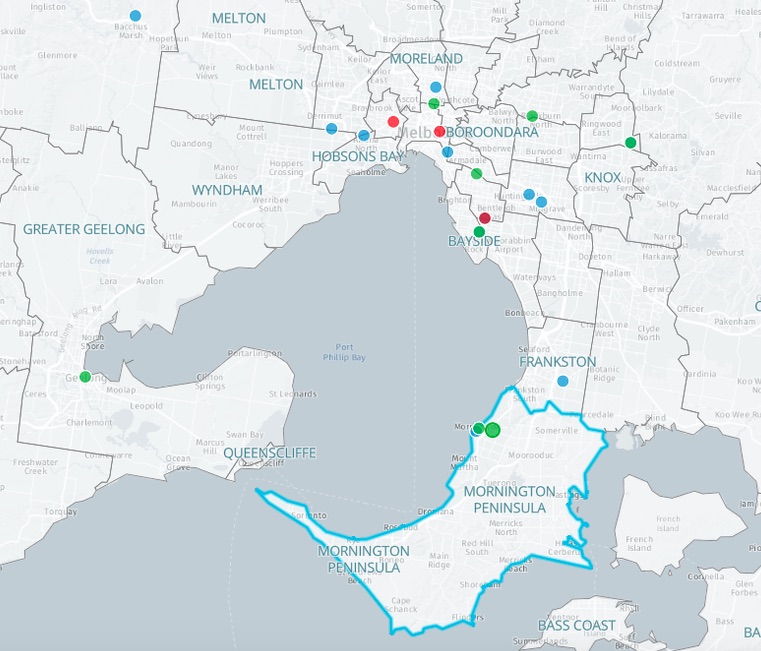
Each grant application shown as a dot on the map (green for Approved, Red for Declined, blue for Undecided).
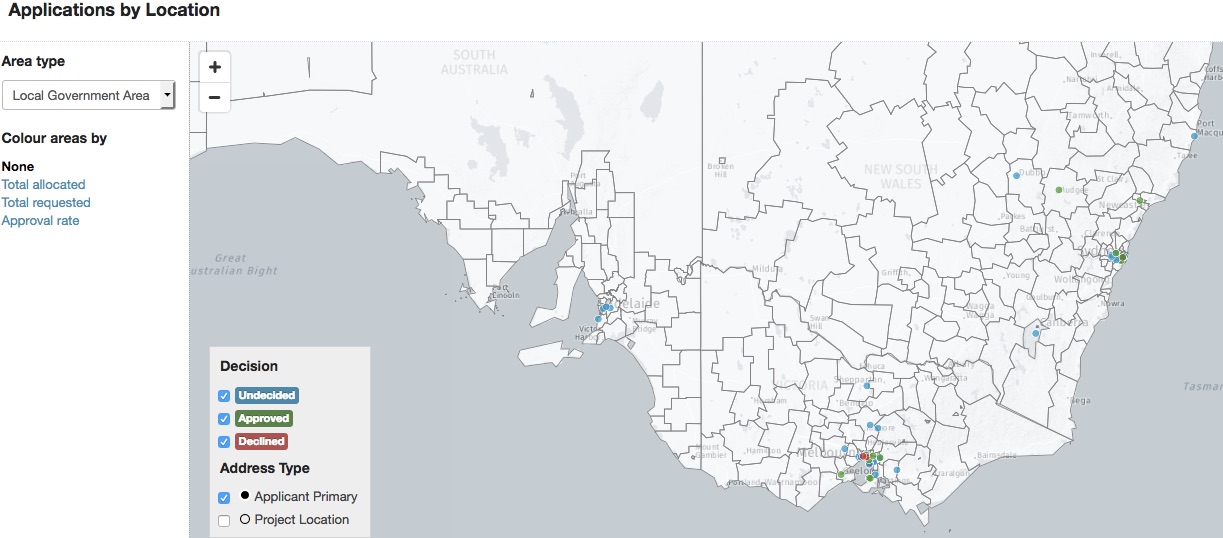
Tag an address with 'Project Location' to make them appear on the map.
Applicant Primary Address will automatically appear on the map.
Each dot can be clicked to reveal a summary of data about the application (address; applicant name; amount requested and granted; project summary; associated applications), or you can click through to the application details.
Filter by:
Program
Round
Date
Status (Undecided, Approved, Declined
Once pointed to an address you can display one of the following overlays on the Maps Dashboard for Australia & New Zealand.
Australia: Federal Electorate, State Electorate, Local Government Area, Remoteness Area, State, Postcode, Suburb.
New Zealand: Regional Councils and Territorial Authority.
Federal electorate: Displays boundaries of each geographically defined area represented by a single elected Member of Parliament .
State electorate: A state electoral district is an area legally prescribed for the purpose of returning one or more members to the State or Territory Lower Houses of Parliament, or the relevant equivalent.
Local Government areas: A local government area (LGA) is the region managed by a local council.
Remoteness area: Remoteness Areas divide Australia into 5 classes of remoteness on the basis of a measure of relative access to services.
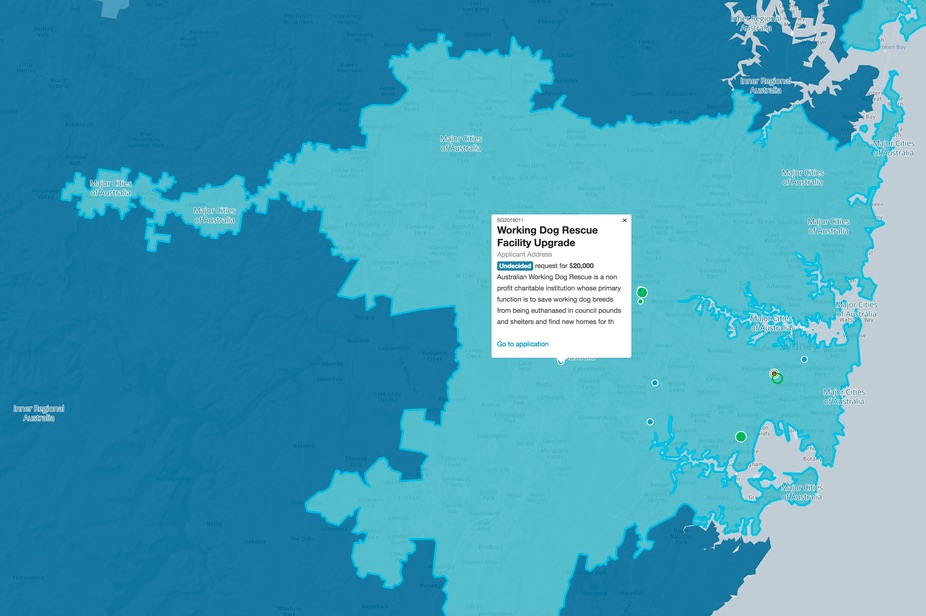
Applying a Lens (heat map)
Applying a heat map is an easy way to visually display where your money is going. You can map funding allocated and approval rates and see the concentration in area of funds and approval distribution.
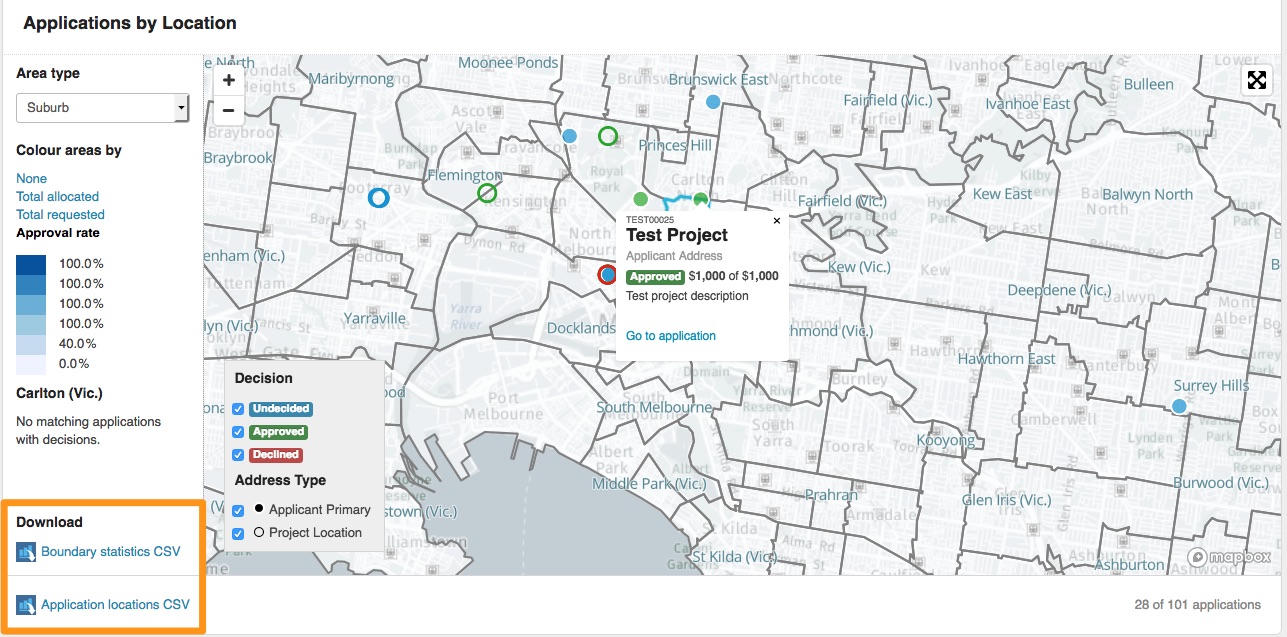
Colour each selected area by total funds allocated, total funds requested, or the approval rate.
Show statistical information for various areas, including:
Funding allocated
Number of applications approved vs declined

Click an individual area for quick summary statistics, such as the total number of grant applications and funding allocated in that area.
You are also able to hide/show the sidebar using the small arrow in the top left hand corner.
Downloading CSV file
You have the ability to download statistical information or application information relating to selected areas as a CSV file. This information is available by clicking into areas of the map and selecting a download link option once you are displaying the information required.
You may also wish to click on the relevant dot (red/green) to show you some basic information about each project.
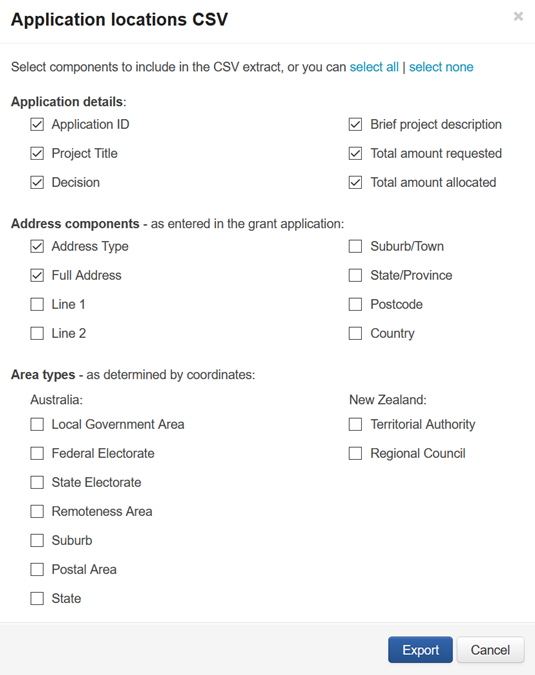
When downloading the Application locations CSV, you can customise the level of detail required in the extract from data points on the map based on:
Application details,
Address components,
Area types.
This report will generate column headings for each of the components selected. The full list of available options are:
Application details: Application ID, Project Title, Decision, Brief project description, Total amount requested, Total amount allocated.
Address components: Address Type, Full Address, Line 1, Line 2, Suburb, State Postcode, Country.
Area types (Australia): Local Government Area, Federal Electorate, State Electorate, Remoteness Area, Suburb, Postal Area, State.
Area types (New Zealand): Territorial Authority, Regional Council.
Pricing and Trial
A 30-day trial version of SmartyGrants Maps is available in all SmartyGrants accounts. This trial can be activated by an Administrator user in the account settings, under 'features'.
During the 30-day trial period you will have use of all the features of SmartyGrants Maps except the Location Lookup field tool (see above for details). If you love SmartyGrants Maps as much as we think you will, you can request a subscription at any time to ensure you continue your service without interruption and get access to the Location Lookup tool.
SmartyGrants Maps is only available to SmartyGrants subscribers and charges are additional to your base SmartyGrants subscription – see here for full details about the costs.
Historical Geocoding
In December 2017 SmartyGrants introduced a feature where by addresses entered into Address fields were automatically geocoded. This however means that addresses collected before this time do not have geocodes recorded, and therefore those applications can’t be displayed on the Map. SmartyGrants are able to provide a quotation for geocoding historical addresses upon requests.
In order for SmartyGrants to prepare a quotation for your historic geocoding, please contact us with the following information:
Which questions on which forms would you like geocoded? Note, we are only able to geocode address questions, not general text questions
For which applications you’d like those questions geocoded
The easiest way to prepare this will be to generate a report template containing those applications and questions.
We will then run those address through the geocoder and provide them to you for your approval before loading the geocodes into SmartyGrants.
Please note that geocoding historic addresses is not always 100% accurate. When we run the geocoding, the output we produce will include information on the ‘accuracy confidence’ of each address. In our experience:
Around 35% get a perfect match on the address,
Around 25% match on the street location but not on the specific house number,
Around 25% match on something larger than street, like the suburb, postcode or state,
Around 15% are not able to return a geocode – generally due to the address not being a valid location (eg a PO Box).
For addresses that you require greater accuracy than what the geocoder has provided, you’re able to determine the geocode by your own means (using Google maps or equivalent) and include that geocode in the spreadsheet ready for import back into SmartyGrants.
If you have any questions, please don’t hesitate to contact us for further information.
FAQ's
What happens to my existing responses if electoral boundaries change?
Lookups work by populating information from various electoral sources such as State electoral sites and Geoscape Australia (formerly PMSA).
Electoral boundaries from time to time may change. If an electoral boundary changes any data that has been collected to that point will reflect the boundary that the address fell into at the time of submission. Any future addresses will keep the data as set when the submission was last updated. To update this data to reflect any changes against an individual application, the manage user can re-open the form where this data was captured and have the applicant re-submit the form. This will trigger the response to reflect to the most up to date data.
What happens to the Map display if the data source indexes change?
Map boundary displays will automatically change to reflect the new data sets when the source data changes. Its worth noting though that some addresses may no longer be part of a boundary that it once fell into. It may be a good idea to review this and download new CSV files if a change occurs.
Data Sources
Boundary Overlay: | Source: |
|---|---|
NZ: Territorial Authority | |
NZ: Regional Council | |
Local Government Area | Local Government Area boundaries (May 2021) |
Federal Electorate | Commonwealth Electoral Boundaries 2021 (AEC) |
State Electorate | State Electorate boundaries Nov 2022 (PSMA) |
Remoteness Area | Australian Bureau of Statistics (2016) |
Suburb | Australian Bureau of Statistics (2016) |
Postal Area | Australian Bureau of Statistics (2016) |
State | Australian Bureau of Statistics (2016) |
The source of the boundary is shown in the bottom right hand corner of the map for some Area types, and contains a clickable link for more information.